Variables
GRAPHING EQUATIONS
OBJECTIVES
- Graphing Equations
- Graph Equations by Point-Plotting
- Determine Intercepts and Symmetry of a Graph
- Graph Equations Using Graphing Calculators
- Solve Problems Using Graphs
As we have already seen, illustrations such as scatterplots and lines of best tit play an important role in helping us investigate the relationship between two quantities. In the case where the relationship between two quantities is described by a two- variable equation, it is often desirable to represent this relationship geometrically with a graph. We restate a definition from earlier.
Graph of an Equation
The graph of an equation in the variables x and y consists of all points in the zy-plane whose coordinates (x, y) satisfy the equation.
Graphing by Point-Plotting
A common technique for obtaining a sketch of the graph of an equation in two vari ables is to first plot several points that lie on the graph and then connect the points with a smooth curve. This is called, naturally, point-plotting.
EXAMPLE 1
Graphing an Equation by Plotting Points
Sketch the graph of y = x^2
Solution
Since the given equation clearly shows how values of y are related to values of x, it seems reasonable to start by assigning several different numbers to x and then find the corresponding values of y to get points that lie on the graph. We then plot these points and connect them with a smooth curve. See Figure l.

Notice that the sketch doesn't show all points on the graph, but it does establish a continuing pattern. If a sketch of the graph of an equation shows enough of the graph so that the viewer is able to "see" the rest of the graph as a continuation of an established pattern, we often call the sketch complete. So, when seeking such a sketch, one approach that might be taken is to plot a sufficient number of points so that a pattern becomes evident and then connect the points by a smooth curve. However, it is not always clear how many points are sufficient. Some knowledge about the given equation and what characteristics to expect the graph of the equation to have is certainly helpful. For instance, we know that the graph of any equation of
the form y = mx +b is a straight line. Often a graphing utility can be very helpful as it has the ability to plot points very rapidly and in large quantity. For now, we will investigate some properties of the graph of an equation that can be obtained from an algebraic analysis of the equation. Later, we will return to the idea of using a graphing utility to obtain a sketch of the graph of an equation.
Intercepts and Symmetry
The points, if any, where a graph touches or crosses one of the coordinate axes are called intercepts. The x-coordinate of a point where a graph touches or crosses the x-axis is called an x-intercept Similarly, the y-coordinate of a point where a graph touches or crosses the y-axis is called a y-intercept, See Figure 2.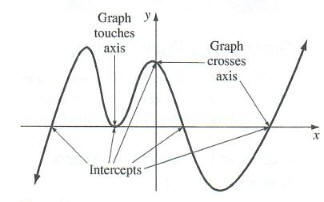
EXAMPLE 2
Finding Intercepts - Identify the x- and y-intercepts for the graph given in Figure 3.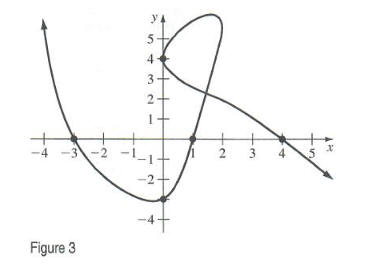
Solution From the graph, we see that there are two y-intercepts: - 3 and 4. Similarly. there are three x-intercepts: - 3, 1, and 4.
The intercepts of the graph of an equation can often be located algebraically by using the fact that points on the x-axis have y-coordinates of zero and points on the y-axis have x-coordinates of zero.