Graphing basic functions and their variations
4.4 — GRAPHING BASIC FUNCTIONS AND THEIR VARIATIONS
Many of the graphs discussed in Chapter 3 are the graphs of functions. By the vertical line test, any straight line that is not vertical is the graph of a function, as is the graph of any vertical parabola. Because of this, linear and quadratic functions can be defined as follows.
LINEAR AND QUADRATIC FUNCTIONS
If a, b, and c are real numbers, then the function defined by
f(x) = ax+b
is a linear function, and the function defined by
f(x) = ax^2+bx+c(a!=0).
is a quadratic function.
Example 1
GRAPHING LINEAR AND QUADRATIC FUNCTIONS AND QUADRATIC
Graph each function defined as follows.
(a)f(x) =-4x+5
This defines a linear function with a slope of -4 and y-intercep5. The graph is shown in Figure 4.4.
b) f(x) =-(x-2)^2+5
The graph of this quadratic function, a parabola with vertex at (2,5) opening downward, is shown in Figure 4.5. 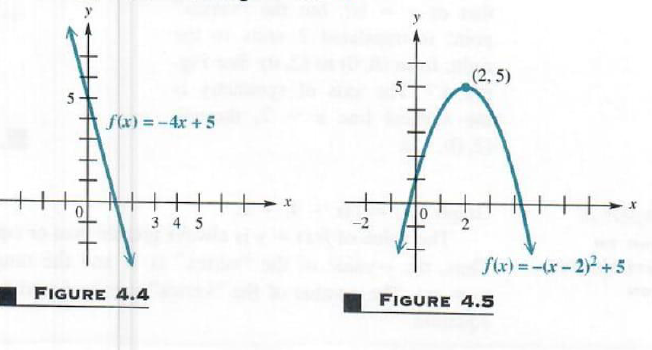
NOTE The function in Example 1(b) is a good illustration of the result of combining simple functions to get a more complicated function. If g(x)=-x^2+5 andh(x)=x-2,thenf(x)=-(x-2)^2+5=(g{omicron}h)(x)
In the rest of this section we discuss the graphs of several basic functions that are neither linear nor quadratic. The graphs of these functions are made up of portions of different straight lines or of straight lines and curves.
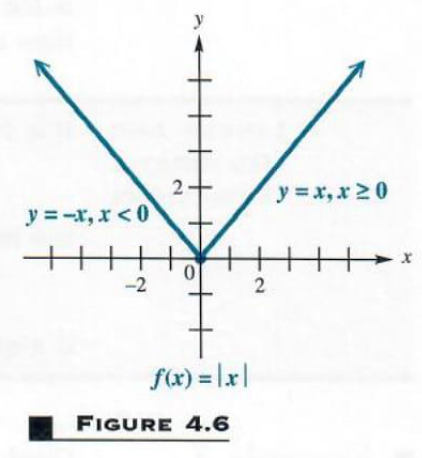
ABSOLUTE VALUE FUNCTIONS One common function that is not linear and not quadratic is the absolute value function, defined by, f(x) = |x| ory = |x|. Since |x| can be found for any real number x, the domain is (-inf,inf. Also, |x|>=0 for any real number x , so the range is (0,inf. When |x|>=0, then y= |x| =x, so y=x is graphed for nonnegative values of x. On the other hand, if x<0, then y= |x| =-x, and y=-xis graphed for negative values of x. The graph is the union of two rays. The final graph is shown in Figure 4.6. By the vertical line test, the graph is that of a function. Notice that the graph of f(x) = |x| is symmetric with respect to the y-axis.
Example 2
GRAPHING AN ABSOLUTE VALUE FUNCTION
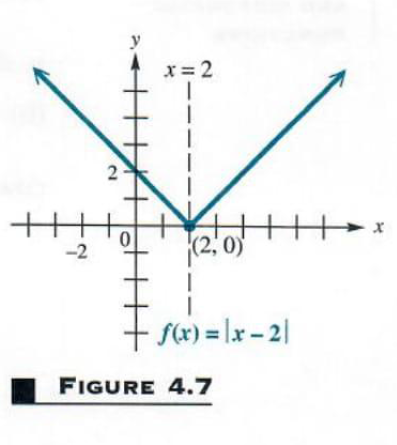
Graph f(x) = |x-2|.
Notice that fis the composite function g{omicron}h, where g(x) = |x| and h(x) = x - 2. The domain of f is (-inf,inf, and the range is (0,inf. This graph has the same shape as that of y = |x|, but the “vertex” .point is translated 2 units to the right, from (0,0)to (2,0). See Figure 4.7. The axis of symmetry is the vertical line x=2 through (2,0)
Example 3
GRAPHING AN ABSOLUTE VALUE FUNCTION
Graph f(x) = |3x +4|+1.
The value of f(x) = y is always greater than or equal to 1, since |3x+4|>=0. Thus, the y-value of the "vertax" is 1, and the range is[1,inf]. The domain is (-inf,inf. The x-value of the “vertex” can be found by substituting 1 for y in the equation.
y= |3x +4|+1
1= |3x +4|+1 Let y=1.
0= |3x +4| Subtract 1.
x=-4/3Solve 3x + 4 = 0
Plotting a few other ordered pairs leads to the graph in Figure 4.8. The graph shows the “vertex” translated to (-4/3,1). The axis of symmetry is x=-4/3. The coefficient of x, 3, determines the slopes of the two rays that form the graph. One has slope 3, and the other has slope -3. Because the absolute value of the slopes is greater than 1, the rays are steeper than the rays that form the graph y = |x|.
FUNCTIONS DEFINED PIECEWISE The graphs of the absolute value functions of Examples 2 and 3 are made up of portions of two different straight lines. Such functions, called functions defined piecewise, are often defined with different equations for different parts of the domain.
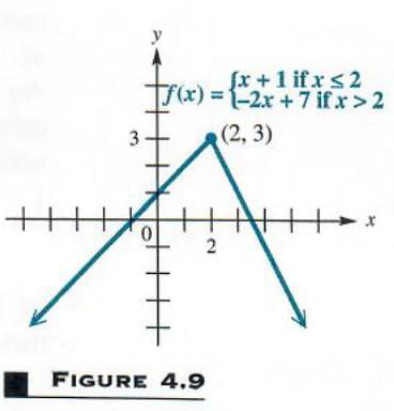
Example 4 GRAPHING A FUNCTION DEFINED PIECEWISE
Graph the function
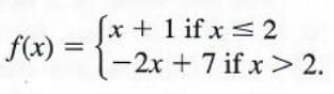
We must graph each part of the domain separately. If x<=2 , this portion of the graph has an endpoint at x=2. Find the y-value by substituting 2 for xin y=x+1 to get y=3. Another point is needed to graph this part of the graph. Choose an x-value less than 2. Choosing x=-1 gives y=-1+1=0. Draw the graph through (2,3)and (-1,0) as ray with an endpoint at (2,3). Graph the ray for x>2 similarly. This ray will have an open endpoint when x=2and y = -2(2) + 7 = 3. Choosing x=4givesy = -2(4) + 7 = -1 . The ray through (2,3)and (4,-1) completes the graph. In this example the two rays
meet at (2,3), although this is not always the case. The graph is shown in Figure 4.9
Example 5 GRAPHING A FUNCTION DEFINED PIECEWISE
Graph
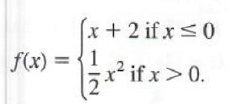
Graph the ray y=x+2, choosing x so that x<=0, with a solid endpoint at (0,2). The ray has slope 1 and y-intercept 2. Then graph y=1/2 for x>0. This graph will be half of a parabola with an open endpoint at (0,0). See Figure 4.10. Notice that, in this example, the two portions do not meet.
GREATEST INTEGER FUNCTIONS Another type of function with a graph composed of line segments is the greatest integer function, written y=[x], and defined as follows:
[x] is the greatest integer less than or equal to x.
For example, [8] = 8 ,[-5]=-5 , [{Pi}] = 3, [12, 1/9]=12, [-2.001] = -3, and So on.
Example 6 GRAPHING THE GREATEST INTEGER FUNCTION
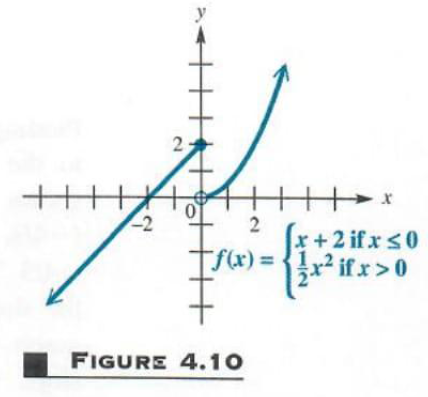
Graph y=[x]
For any value of x in the interval 0,1, [x]=0. Also, for x in 1,2,[x]=1. This process continues; x in 2,3, the value of [x] is 2. The values of y are constant between integers, but they jump at integer values of x. This makes the graph, shown in Figure 4.11, a series of line segments. In each case, the left endpoint of the segment is included, and the right endpoint is excluded. The domain of the function is ,(-inf,inf, while the range is the set of integers, {...,-2,-1,0,1,2,...}.
Each of the graphs in Examples 6, 7, and 8 is made up of a series of horizontal line segments. (See Figures 4.11, 4.12, and 4.13.) The functions producing these graphs are called step functions.
IN SIMPLEST TERMS
Special functions called step functions are used when the range value is expected to remain constant for a given interval of domain values. For example, parking fees are often calculated by charging a certain flat fee for the first hour and a different fee for each additional hour (or fraction of an hour).
Suppose Downtown Daily Parking charges a $5 base fee for the first hour and $1for each additional hour or fraction thereof. The maximum fee per day is $15. It would cost $5+ $1(6) = $11 to park for 7 hours.
SOLVE EACH PROBLEM
A. How much would it cost to park at Downtown Daily Parking for 3.5 hours?
B. Melissa and her children plan to spend the entire day touring the city. How much would it cost her to park at Downtown Daily Parking for 12hours?
ANSWERS A. It would cost $8. B. it would cost $15, the maximum charge per day.
Example 7 GRAPHING A STEP FUNCTION
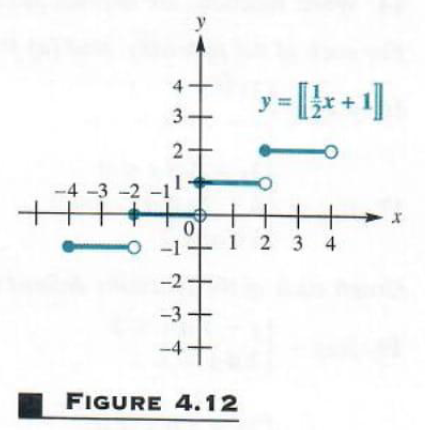
Graph y=[1/2x+1
Try some values of x in the equation to see how the values of y behave. Some sample ordered pairs are given here.
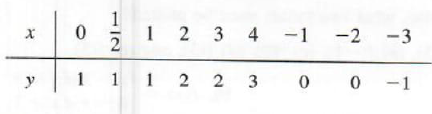
These ordered pairs suggest that if x is in the interval 0,2, then y=1. For x in 2,4, y=2
2, and so on. The graph is shown in Figure 4.12. Again, the domain is (-inf,inf. The range is{...-1,0,1,2,...}.
The greatest integer function can be used to describe many common pricing practices encountered in everyday life, as shown in the next example.
Example 8 APPLYING THE GREATEST INTEGER FUNCTION
An express mail company charges $10 for a package weighing 1 pound or less. Each additional pound or part of a pound costs $3 more. Find the cost to send a package weighing 2 pounds; 2.5 pounds; 5.8 pounds. Graph the ordered pairs (pounds, cost). Is this the graph of a function?
The cost for a package weighing 2 pounds is $10 for the first pound and $3 for the second pound, for a total of $13. For a 2.5-pound package, the cost will be the same as for 3 pounds: 10 + 2(3) = 16, or $16. A 5.8-pound package will cost the same as a 6-pound package: 10 + 5(3) = 25, or $25. The graph of this step function is shown in Figure 4.13. Notice that the nght endpoints are included in this case, instead of the left endpoints.
INVERSE FUNCTIONS
Addition and subtraction are inverse operations: starting with a number x, adding 5, and subtracting 5 gives x back as a result. Similarly, some functions are inverses of each other. For example, the functions
f(x)=8x and g(x)=1/8x
are inverses of each other. This means that if a value of x such as x=12 is choosen, so that
f(x)=8*12=96
calculating g(96) gives
g(96)=1/8*96=12
Thus,g[ f(12)] = 12 .
Also, f[ g(12)] = 12. For these functions fand g, it can be shown that f[ g(x)] =x and g[ f(x)] =x for any value of x.
This section will show how to start with a function such as f(x)=8x and obtain the inverse function g(x) = (1/8)x . Not all functions have inverse functions. The only functions that do have inverse functions are one-to-one functions.
ONE-TO-ONE FUNCTIONS For the function y=5x-8, any two different values of x produce two different values of y. On the other hand, for the function y=x^2, two different values of x can lead to the same value of y; for example, both x=4 and x=-4 give y = 4^2 = (-4)^2 =16.A function such as y = 5x -8,where different elements from the domain always lead to different elements from the range, is called a one-to-one function.
ONE-TO-ONE FUNCTION A function f is a one-to-one function if, for elements aandb from the do main of f,
a!=b implies f(a)!=f(b)
Example 1 DECIDING WHETHER A FUNCTION IS ONE-TO-ONE
Decide whether each of the following functions is one-to-one.
(a)f(x) = -4x + 12
Suppose that a!=b. Then -4a!=-4b, and -4a+12!=-4b+12. Thus, the fact that a!=b implies that f(a)!=f(b), so f is one-to-one.
(b) f(x)=root(25-x^2
If a=3 and b=-3, then 3!=-3, but
f(3)=root(25-3^2)=root(25-9)=root(16)=4
f(-3)=root(25-(-3)^2)=root(25-9)=4
Here, even though 3!=-3, f(3)!=f(-3). By definition, this is not a one-to-one function.
As shown in Example 1(b), a way to show that a function is not one-to-one is to produce a pair of unequal numbers that lead to the same function value. There is also a useful graphical test that tells whether or not a function is one-to-one. This horizontal line test for one-to-one functions can be summarized as follows.
HORIZONTAL LINE TEST If each horizontal line intersects the graph of a function in no more than one point, then the function is one-to-one.
NOTE In Example 1(b), the graph of the function is a semicircle. There are infinitely
many horizbatal lines that cut the graph of a semicircle in two points, so the horizontal line test shows that the function is not one-to-one.
Example 2 USING THE HORIZONTAL LINE TEST
Use the horizontal line test to determine whether the graphs in Figures 4.14 and 4.15 are graphs of one-to-one functions.
(a)
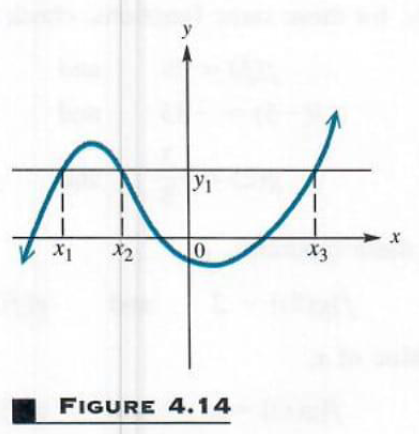
Each point where the horizontal line intersects the graph has the same value of y but a different value of x. Since more than one (here three) different values of x lead to the same value of y, the function is not one-to-one.
(b)
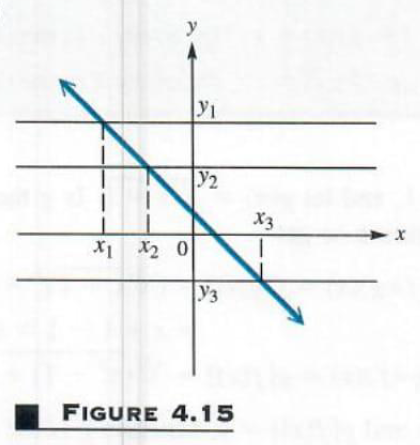
Every horizontal line will intersect the graph in Figure 4.15 in exactly one point. This function is one-to-one.
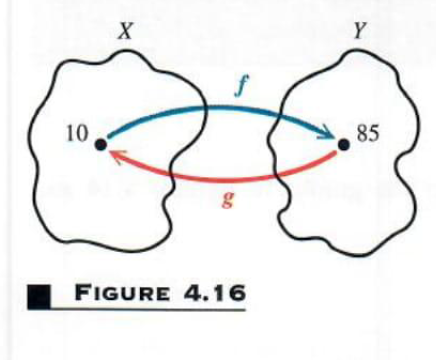
INVERSE FUNCTIONS As mentioned earlier, certain pairs of one-to-one functions “undo” one another. For example, if
f(x)=8x+5 and g(x)=(x-5)/8
f(10)=8*10+5=85 and g(85)=(85-5)/8=10
Starting with 10, we “applied” function f and then “applied” function g to the result, which gave back the number 10. See Figure 4.16. Similarly, for these same functions, check that
f(3)=29 and g(29)=3,
f(-5)=-35 and g(-35)=-5
g(2)=-3/8 and f(-3/8)=2
In particular, for these functions,
f[g(x)]=2 and 8[f(2)]=2
In fact for any value of x,
f [g (x)]=x and g[f(x)]=x
or (f{omicron}g)(x)=x and (g{omicron}f)(x)=x
Because of this property, g is called the inverse of f.
INVERSE FUNCTION Let f be a one-to-one function. Then g is the inverse function of f if
(f{omicron}g)(x)=x for every x in the domain of g,
and (g{omicron}f)(x)=x for every in the domain of f
Example 3 DECIDING WHETHER TWO FUNCTIONS ARE INVERSES
Let f(x)=x^3-1, and let g(x)=root(3,x+1). Is g the inverse function of f ?
Use the definition to get
(f{omicron}g)(x)=f[g(x)]=(root(3,x+1))^3-1
=x+1-1=x
(g{omicron}f)(x)=g[f(x)]=root(3,(x^3-1)+1)=root(3,x^3=x
Sincef [g (x)]=x and g[f(x)]=x, function g is the inverse of function f. Also, f is the inverse of function g.
A special notation is often used for inverse functions: if g is the inverse function of f, then g can be written as f^-1 (read “f-inverse”). In Example 3,
f^-1(x)=root(3,x+1)
CAUTION Do not confuse the -1 in f^-1 with a negative exponent. The symbolf^-1(x) does not represent 1/(f(x)); it represents the inverse function of f. Keep in mind that a function f can have an inverse function f^-1 if and only if f is one-to-one.
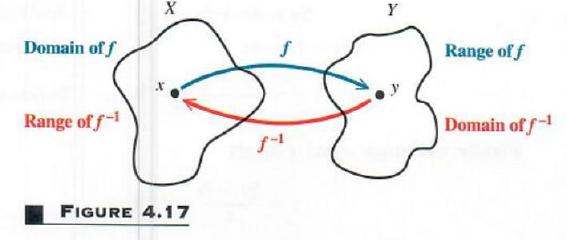
The definition of inverse function can be used to show that the domain of f
equals the range of f^-1, and the range of f equals the domain of f^-1. See Figure 4.17.
For the inverse functions f and g discussed at the beginning of this section,
f(12) = 96 and g(96) = 12; that is (12,96) belonged to f and (96,12) belonged to g. The inverse of any one-to-one function f can be found by exchanging the components of the ordered pairs of f. The equation of the inverse of a function defined byy = f(x) also is found by exchanging x and y. For example, if f(x) = 7x -2, then y= 7x -2. The function f is one-to-one, so that f^-1 exists. The ordered pairs in f^-1 have the form(y, x) , where x=f^-1(y). Thus, we can solve the equation y= 7x -2 for x to find f^-1(y). Since it is customary to use x as the independent variable, we then exchange xand y to get y=f^-1(x).
y=7x-2
7x=y+2 Add 2.
x=(y+2)/7=f^-1(y) Divide by 7.
y=(x+2)/7=f^-1(x) Exchange x and y.
Check that (f{omicron}f^-1)(x)=x and (f^-1{omicron}f)(x)=x, so that f^-1 is the correct inverse of f.
In summary, finding the equation of an inverse function involves the following steps.
FINDING AN EQUATION FOR f^-1
1. Verify that f is a one-to-one function.
2, Replace f(x) with y.
3. Solve for x. Let x=f^-1(y).
4. Exchange x and y to get y=f^-1(x).
5. Verify that (f{omicron}f^-1)(x)=x
Example 4 FINDING THE INVERSE OF A FUNCTION
For each of the following functions, find the inverse function, if it exists.
(a) f(x)=(4x+6)/5
This function is one-to-one and thus has an inverse. Let f(x) = y, and solve for x, getting
y=(4x+6)/5
5y=4x+6 Multiply by 5.
5y-6=4x Substract 6
x=(5y-6)/4=f^-1(y) Divide by 4
Finally, exchange x and y to get
y=(5y-6)/4=f^-1(x)
or f^-1(x)=(5x-6)/4
The domain and range of both f and f^-1 are the set of real numbers. In function f the value of y is found by multiplying x by 4, adding 6 to the product, then dividing that sum by 5. In the equation for the inverse, x is multiplied by 5, then 6 is subtracted, and the result is divided by 4. This shows how an inverse function is used to “undo” what a function does to the variable x.
(b) f(x)=x^3-1
Two different values of x will produce two different values of x^3-1, so the function is one-to-one and has an inverse. To find the inverse, first solve y=x^3-1 for x, as follows.
y=x^3-1
y+1=x^3 Add 1.
3root(y+1)=x Take cube roots.
Exchange x and y, giving
root(3,x+1)=y
or f^-1(x)=root(3,x+1).
In Example 3, we verified that 3root(x+1) is the inverse of x^3-1.
(c) f(x)=x^2
We can find two different values of x that give the same value of y. For example, both x=4and x=-4 give y=16. Therefore, the function is not one-to-one and thus has no inverse function.
Suppose f and f^-1 are inverse functions, andf(a) = 6 for real numbers aand b. Then, by the definition of inverse, f^-1(b)=a. This shows that if a point (a,b) is on the graph of f, then (b,a) will belong to the graph of f^-1. As shown in Figure 4.18, the points (a,b) and (b,a) are symmetric with respect to the line y=x. Thus, the graph of f^-1 can be obtained from the graph of f by reflecting the graph of f about the line y=x.
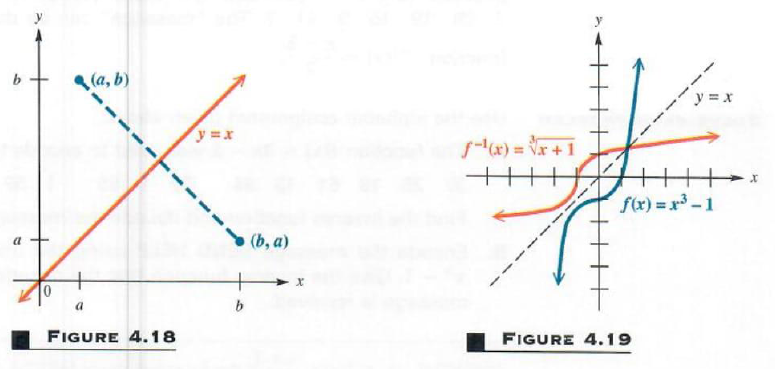
For example, Figure 4.19 shows the graph of f(x)=x^3-1 in blue and the graph of f^-1(x)=root(3,x+1) in red. These graphs are symmetric with respect to the line y=x.
Example 5 FINDING THE INVERSE OF A FUNCTION WITH A RESTRICTED DOMAIN
Let f(x)=root(x+5) with domain [-5,inf]. Find f^-1(x).
The function f is one-to-one and has an inverse function. To find this inverse
function, start with
y=root(x+5)
and solve for x, to get
y^2=x+5 Square both sides.
y^2-5=x Subtract 5.
Exchanging x and y gives
x^2-5=y
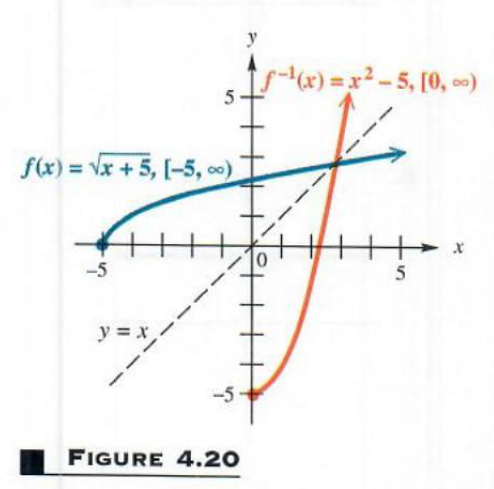
However, x^2-5 is not f^-1(x). In the definition of f above, the domain was given as [-5,inf]. The range of f is [0,inf]. As mentioned above, the range of f equals the domain of f^-1, so f^-1 must be given as
f^-1(x)=x^2-5 domain [0,inf]
As a check, the range off^-1, [-5,inf], equals the domain of f. Graphs of f and f^-1 are shown in Figure 4.20. The line y=x is included on the graph to show that the graphs of f and f^-1 are mirror images with respect to this line.
IN SIMPLEST TERMS
Inverse functions are used by government agencies and other businesses to send and receive coded information. The functions they use are usually very complicated. A simple example involves the function f(x) = 2x + 5. If each letter of the alphabet is assigned a numerical value according to its position (a=1,...,z=26, the word ALGEBRA would be encoded as7 29 191594177. The “message” can be decoded using the inverse functionf^-1(x)=(x-5)/2
SOLVE EACH PROBLEM Use the alphabet assignment given above.
A. The function f(x) = 3x -2 was used to encode the following message:
372519611334221551525225641310777 Find the inverse function and decode the message.
B. Encode the message SEND HELP using the one-to-one functionf(x) = x^3 -1 . Give the inverse function that the decoder would need when the message is received.
ANSWERS A. f^-1(x)=(x+2)/3 the message reads MIGUEL HAS ARRIVED.
B.685812427436351112417274095;f^-1(x)=root(3,x+1)