Coordinates in the plane & Graphing Equation in two variables
7.1 Coordinates in the Plane
Let PI be a plane and let X and Y be mutually perpendicular lines in PI intersecting at the point O. Using the lines X and Y we will associate a number pair with each point in the plane. If P is a point and (a,b) is the pair associated with P, then a and b are the coordinates of P. The number a is the abcissa or first coordinate of P. while b is the ordinate or second coordinate of P. We denote a point and its coordinates by
P: (a,b).
The coordinates of P are determined in the following way. Choose a direction from O along X as the positive direction on X and, similarly, choose a positive direction for Y. It is customary to choose the positive directions as indicated by the arrows in Figure 1. Choosing some unit of measure on each of the two lines, we mark off positive distances in the positive direction on X and Y and negative distances in the other direction on each line, so that each point on an axis is at a directed distance from the origin O. See Figure 2. Let k and h be the lines on
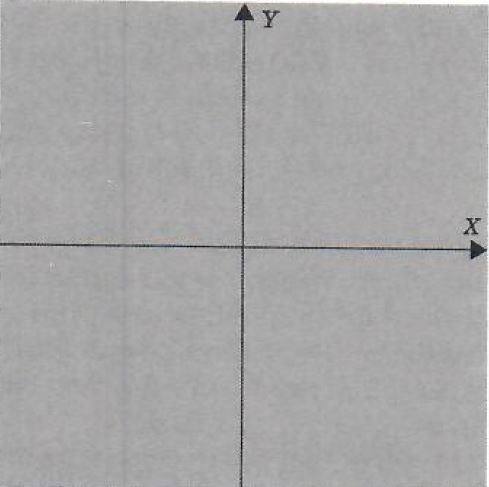
FIGURE 1.
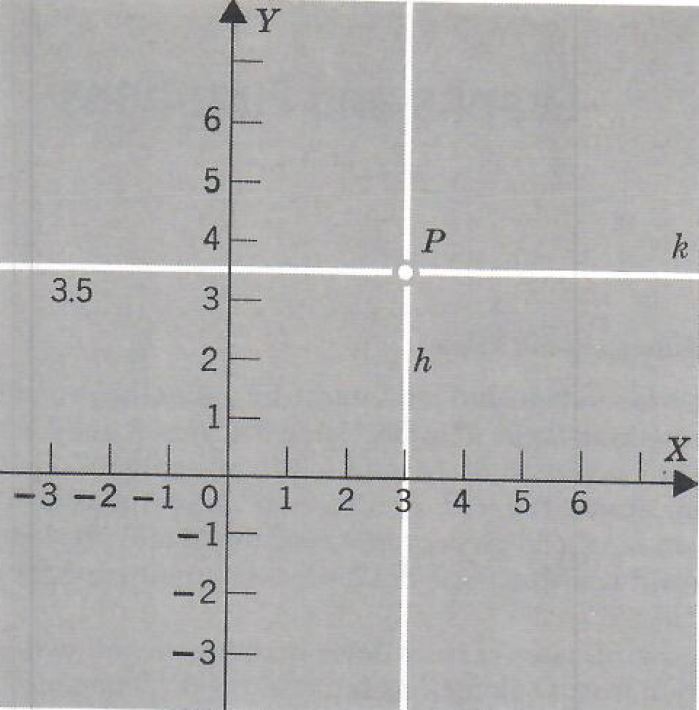
FIGURE 2.
P which are parallel to X and Y, respectively. Then h intersects X in a point at directed distance {alpha} from point O, while k intersects Y at a point at directed distance b from point O. Then the coordinate pair of P is (a,b). In Figure 2, the coordinate pair of P is (3, 3.5).
The lines X and Y together with the positive directions and the unit of measure are called a Cartesian coordinate system for the plane. A plane in which a coordinate system is introduced is called a coordinate plane. The lines X and Y are the horizontal and vertical axes, respectively, of the system, and their point of intersection O is the origin of the system.
We observe that the axes divide the plane into four parts called the quadrants of the plane. Numbering counterclockwise from the upper right quadrant they are the first, second, third, and fourth quadrants of the plane. All the points in the first quadrant have both coordinates positive, those in the second have the first coordinate negative and second coordinate positive, and so on.
One simple problem that arises is locating or plotting a point whose coordinates are given. A second is to estimate the coordinates of a given point.
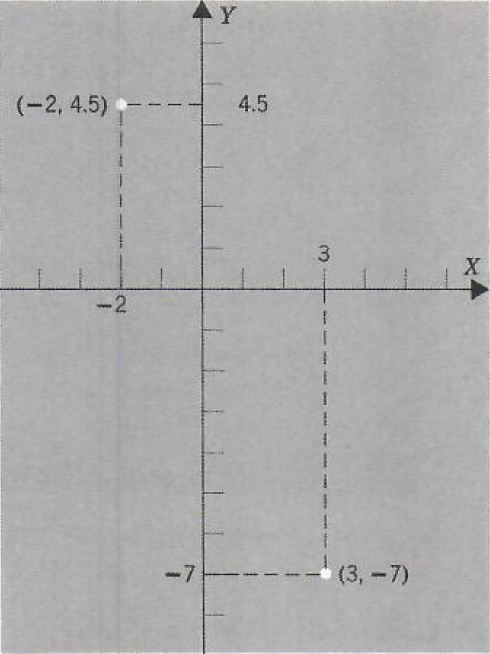
Example 1. Plot (-2,4.5) and (3,-7).
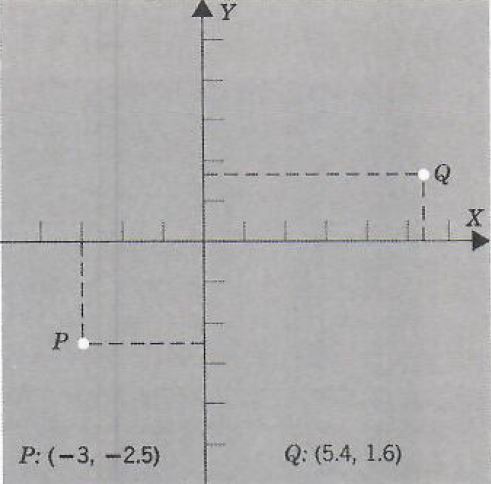
Example 2. Estimate the coordinates of P and Q given below.
Using the Pythagorean formula from plane geometry we can arrive at a formula for the distance between two points in terms of the co-ordinate of those points. Let P: (X1,Y1) and Q: (X2,Y2) be given. Denote the distance between P and Q by d(P,Q). See Figure 3. By the Pythagorean theorem
d(P,Q)=√(a^2+b^2)
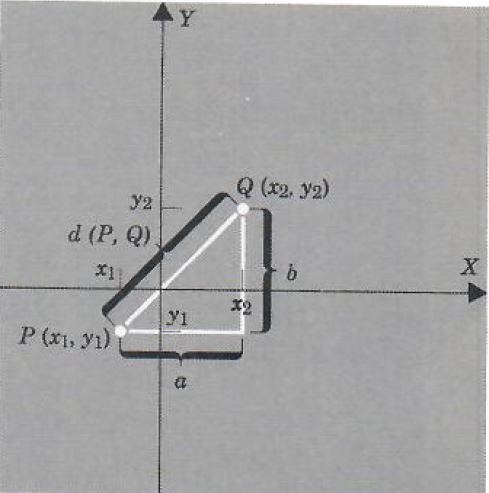
FIGURE 3.
Since
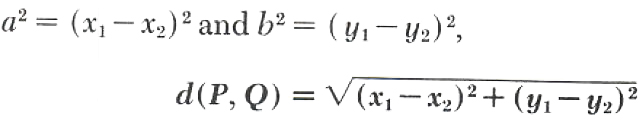
Example 3. Plot the points P:(-4,3) and Q:(2,-1) and find the distance between them.
d(P,Q)=√((-4-2)^2+[3-(-1)]^2)
=√(36+16)
=√52
7.2 Graphing Equations in Two Variables
Consider the equation in two variables
(1) x-2y=4
A solution of this equation is a pair of numbers (a,b) such that on making the substitution x=a,y=b into (1), a true numerical statement results. Thus (4,0) and (6, 1) are solutions, while (1, 2) is not a solution. The solution set of (1) is the set of all the solution pairs.
We symbolize the general situation in the following way. Let {Epsilon}(x,y) stand for any expression in the variables x and y. Then a solution of
(2) {Epsilon}(x,y)=0
is a pair of numbers (a,b) such that the substitution x=a, y=b into (2) results in a true numerical statement. The solution set is the set of all solution pairs.
Since the solution set of (2) is a set of real number pairs, we may plot these pairs as points in a coordinate plane. The resulting figure in the plane is called the graph of (2). For most equations we can plot only a finite number of points exactly and then make a (more or less) educated guess at the other points.
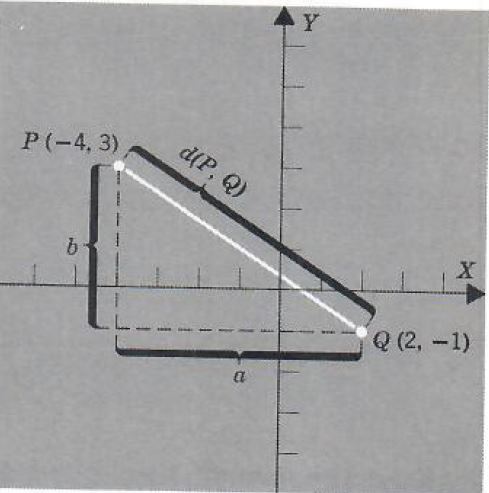
Example 1. Graph x-2y=4.
First we construct a table listing some of the solution pairs
| x | y | Computations |
| -2 | -3 | -2-2y=4so -2y=6,y=-3 |
| -1 | -(5/2) | -1-2y=4 so -2y=5,y=-(5/2) |
| 0 | -2 | |
| 1 | -(3/2) | |
| 2 | -1 | |
| 3 | -(1/2) | |
| 4 | 0 | |
| 5 | 1/2 | |
| 6 | 1 |
Then plot these points in a coordinate plane. These points seem to lie on a straight line and we may reasonably guess that they do. In fact, we shall soon see that they are collinear.
Let's see how our solver generates graph of this equation and similar equations. Click on "Solve Similar" button to see more examples.
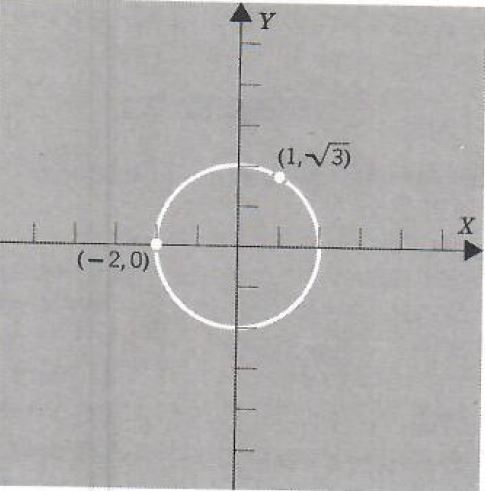
Example 2. Graph x^2+y^2=4.
Construct a table of solution pairs.
| x | y | Computations |
| -2 | 0 | (-2)^2+y^2=4,y^2=0 so y=0 |
| -1 | +-√3 | (-1)^2+y^2=4,y^2=3 so y=+-√3 |
| 0 | +-2 | |
| 1 | +-√3 | |
| 2 | 0 |
Plot these points in a coordinate plane. These points seem to lie on the circle with center (0,0) and radius 2. We will eventually show that this is indeed the case.
Let's see how our solver generates graph of this equation and similar equations. Click on "Solve Similar" button to see more examples.
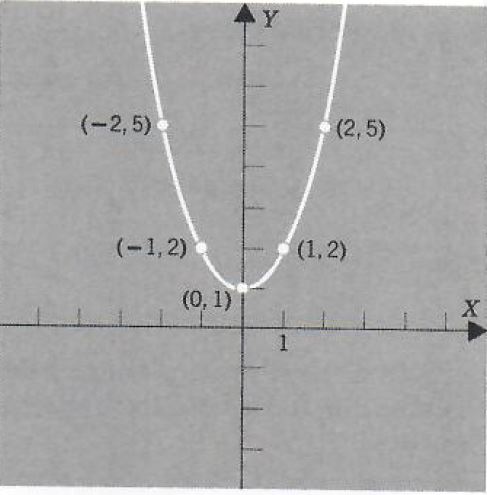
Example 3. Graph y=x^2+1.
Construct a table of solution pairs.
| x | y |
| -3 | 10 |
| -2 | 5 |
| -1 | 2 |
| 0 | 1 |
| 1 | 2 |
| 2 | 5 |
| 3 | 10 |
Plot these points in a coordinate plane and connect them with a smooth curve.
Let's see how our solver generates graph of this equation and similar equations. Click on "Solve Similar" button to see more examples.