Quadratic relation, parabolas : translations and applications
PARABOLAS: TRANSLATIONS AND APPLICATIONS
QUADRATIC RELATION A quadratic relation in two variables is a relation that can be written in the form
y=ax^2+bx+c or x=ay^2+by+c
where a, b, and c are real numbers, and a!=0.
The graphs of quadratic relations are called parabolas. The simplest quadratic relation of the form y=ax^2+bx+c is y=x^2, with a=1, b=0, and c=0, so this relation is graphed first.
Example 1 GRAPHING THE SIMPLEST QUADRATIC RELATION
Graphy = x^2
Set x equal to 0 in y = x^2 to get y = 0, which shows that the only intercept is at the origin. By plotting other selected points, as shown in the table accompanying Figure 3.16, we obtain the graph. The domain is (-inf,inf)and the range is [0,inf]
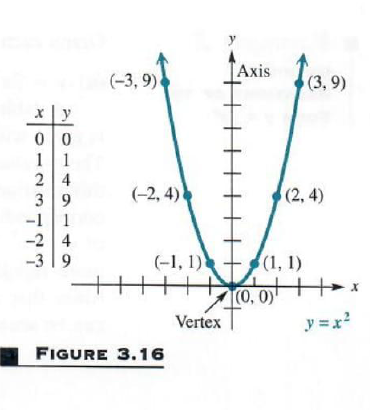
NOTE The domain and the range of a parabola with a vertical axis, such as the one in Figure 3.16, can be determined by looking at the graph. Since the graph extends indefinitely to the right and to the left, we see that the domain is (-inf,inf), Since the lowest point on the graph is (0,0), the minimum range value (y-value) is 0. The graph extends upward indefinitely, indicating that there is no maximum y-value, and so the range is [0,inf]. (Domains and ranges of other types of relations can also be determined by observing their graphs.)
Notice in Figure 3.16 that the part of the graph in quadrant II is a “mirror image” of the part in quadrant I. We say that this graph is symmetric with respect to the y-axis. (More will be said about symmetry in the next section.) The line of symmetry for a parabola is the axis of the parabola. The lowest point on this parabola, the point (0,0), is called the vertex of the parabola.
Starting with y = x^2, there are several possible ways to get a more general
expression:
y = ax^2 Multiply by a positive or negative coefficient.
y = x^2+k positive or negative constant
y = (x-h)^2 Replace x with x-h, where his a constant
y = a(x-h)^2+k Do all of the above.
The graph of each of these relations is still a parabola, but it is modified from that of y = x^2. The next few examples show how these changes modify the parabola. The first example shows the result of changing y = x^2 toy = ax^2.
Example 2 GRAPHING RELATIONS OF THE FORM y = ax^2
Graph each relation.
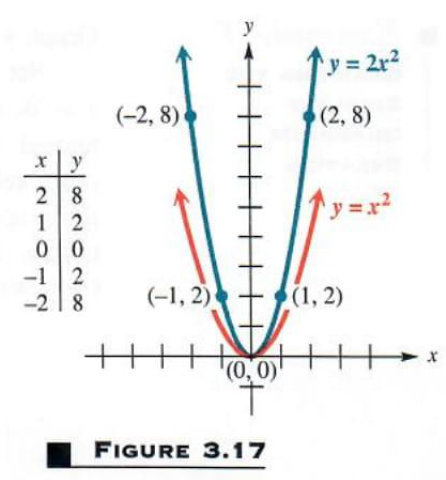
(a) y = 2x^2
A table of selected ordered pairs is given with the graph in Figure 3.17. The y-values of the ordered pairs of this relation are twice as large as the corresponding y-values for the graph of y = x^2. This makes the graph rise more rapidly, so the parabola is narrower than the parabola for y = x^2, as can be seen in the figure.3.17
Let’s see how our solver generates graph of this and similar problems. Click on "Solve Similar" button to see more examples.
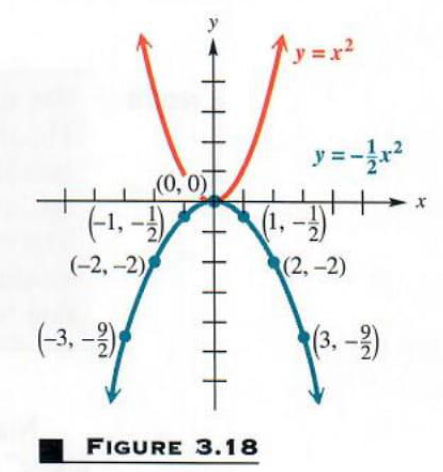
(b) y = -1/2x^2
The coefficient -1/2 causes the y-values to be closer to the x-axis than for y = x^2, making the graph broader than that of y = x^2. Because the y-values are negative for each nonzero x-value, this graph opens downward. Again the axis is the line x=0, and the vertex, the highest point on the graph, is (0,0). The domain is (-inf,inf) and the range is (-inf,0). See Figure 3.18.
Let’s see how our solver generates graph of this and similar problems. Click on "Solve Similar" button to see more examples.
As Example 2 suggests, |a| in y = ax^2 determines the width of a parabola, so that it is narrower than the graph of y = x^2. when |a|>1 and broader than the graph of y = x^2 when |a|<1.
The next two examples show how changing y = x^2 to y = x^2+k or to
y = (x-h)^2, respectively, affects the graph of a parabola.
Example 3
GRAPHING A RELATION OF THE y = x^2+k
Graph y = x^2-4
Each value of y will be 4 less than the corresponding value of y = x^2. This means that y = x^2-4 has the same shape as y = x^2 but is shifted 4 units down. See Figure 3.19. The vertex of the parabola (on this parabola, the lowest point) is at (0,-4). The axis of the parabola is the vertical line x=0. When the vertex of a parabola is shifted vertically, the intercepts are usually good choices for additional points to plot. Here,
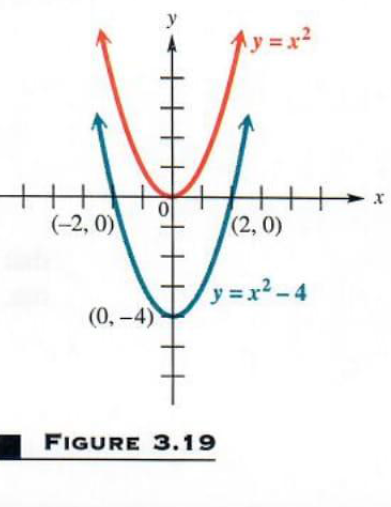
the y-intercept is -4, which is the y-value of the vertex. The x-intercepts are found by setting y=0:
y=x^2-4
0=x^2-4
4=x^2
x=2 or x=-2
The x-intercepts are 2 and -2.
The vertical shift of the graph in Example 3 is called a translation. Example 4 below shows a horizontal translation, which is a shift to the right or left.
Example 4 GRAPHING A RELATION OF THE FORM y={x-h}^2
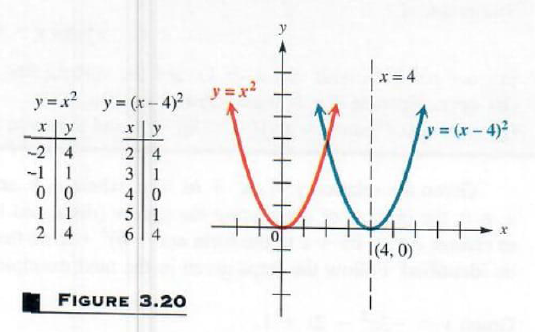
Graph y=(x-4)^2
Comparing the two tables of ordered pairs shown in Figure 3.20, for y = x^2and y=(x-4)^2, indicates that this parabola is translated 4 units to the right as compared to the graph of y = x^2. For example, the vertex is (4, 0) instead of (0,0), and x=-2 in y = x^2 corresponds to the same y-value as x=2 in y=(x-4)^2, a difference of 2-(-2)=4 units. The axis of y=(x-4)^2 is the vertical line
x=4. See Figure 3.20.
CAUTION - Errors frequently occur when horizontal translations are involved. In order to determine the direction and magnitude of horizontal translations, find the value that would cause the expression x-h to equal 0. For example, the graph of y=(x-5)^2 would be shifted 5 units to the right, because +5 would cause x-5 to equal 0. On the other hand, the graph of y=(x+4)^2 would be shifted 4 units to the left, because -4 would cause (x+4) to equal 0.
A combination of all the transformations illustrated in Examples 2, 3, and 4 is shown in the next example.
Example 5
GRAPHING A RELATION OF THE FORM y=a(x-h)^2+k
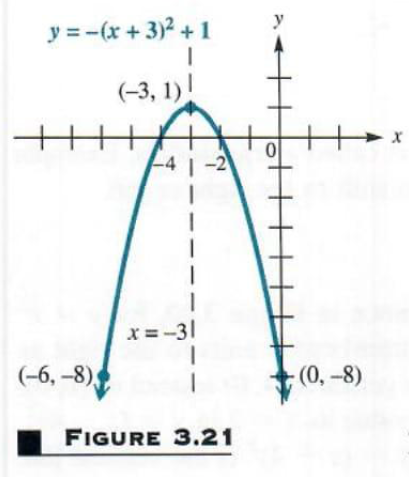
Graph y=-(x+3)^2+1.
This parabola is translated 3 units to the left and 1 unit up. Because of the negative sign, it opens downward, so that the vertex, the point (-3,1), is the highest point on the graph. The axis is the line x=-3. The y-intercept is y=-(0+3)^2+1=-8 . By symmetry about the axis x=-3, the point (-6,-8) also is on the graph. The x-intercepts are found by solving the equation
0=-(x+3)^2+1
0=-(x^2+6x+9)+1 Square the binomial.
0=-x^2-6x-9+1 Distributive property
0=-x^2-6x-8
0=x^2+6x+8 Multiply by —1.
0=(x+2)(x+4). Factor.
from which x=-2 or x=-4. The graph is shown tn Figure 3.21. Noticed from the graph that the domain is (-inf,inf) and the range is (-inf,1). The y-value of the vertex determines the range.
Examples 2-5 suggest the following generalizations.
Let’s see how our solver generates graph of this and similar problems. Click on "Solve Similar" button to see more examples.
GRAPH OF A PARABOLA
The graph of y=a(x-h)^2+k, where a!=0,
(a) is a parabola with vertex (h, k), and the vertical line x=h as axis;
(b) opens upward ifa > 0 and downward if a < 0;
(c) is broader than y = x^2 if 0 < |a| < 1 and narrower than y = x^2 if |a| > 1.
Given the relation y=ax^2+bx+c, where a, b, and c are real numbers and a!=0, the process of completing the square (discussed in Chapter 2) can be used to change ax^2+bx+c to the form a(x-h)^2+kso that the vertex and axis may be identified. Follow the steps given in the next example.
Example 6
GRAPHING PARABOLA BY COMPLETING THE SQUARE
Graph y=-3x^2-2x+1.
A Our goal is to write the equation in the form y=a(x-h)^2+k. We may start by dividing both sides by -3 to get
y/-3=x^2+2/3x-1/3
Now complete the procedure, as explained in Section 2.4.
y/-3+1/3=x^2+2/3x Add 1/3 to both sides.
y/-3+1/3+1/9=x^2+2/3x+1/9 [1/2(2/3)]^2=1/9, so add 1/9 to both side.
y/-3+4/9=(x+1/3)^2 Combine terms on the left, Factor on the right.
y/-3=(x+1/3)^2-4/9 Subtract 4/9.
y=-3(x+1/3)^2+4/3 Multiply by -3.
or y=-3[x-(-1/3)]^2+4/3
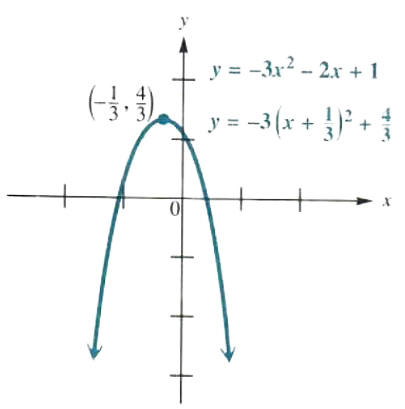
Figure 3.22
Now the equation of the parabola is written in the form y = a(x - h)^2 + k, and this rewritten equation shows that the axis of the parabola is the vertical line x=-1/3 and that the vertex is (-1/3,4/3). Use these results, together with the intercepts and additional ordered pairs as needed, to get the graph in Figure 3.22. From the graph, the domain of the relation is (-∞,∞) and the range is (-∞,4/3).
Let’s see how our solver generates graph of this and similar problems. Click on "Solve Similar" button to see more examples.
A formula for the vertex of the graph of the quadratic relation y = ax + bx + c can be found by completing the square for the general form of the equation.
y=ax^2+bx+c (a!=0)
y/a=x^2+b/(a)x+c/a Divide by a
y/a-c/a=x^2+b/(a)x Subtract c/a.
y/a-c/a+(b^2)/(4a^2)=x^2+b/(a)x+(b^2)/(4a^2) Add (b^2)/(4a^2)
y/a+(b^2-4ac)/(4a^2)=(x+b/(2a))^2 Combine terms on left and factor on right.
y/a=(x+b/(2a))^2-(b^2-4ac)/(4a^2) Get y term alone on the left.
y=a(x+b/(2a))^2+(4ac-b^2)/(4a) Multiply by a
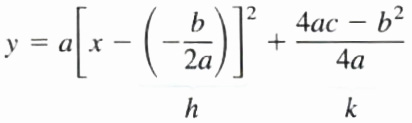
The final equation shows that the vertex (h, k) can be expressed in terms of a,b, and c. However, it is not necessary to memorize the expression for k. since it can be obtained by replacing x with -b/(2a).
VERTEX OF A PARABOLA (Y=ax^2+bx+c)
The x-value of the vertex of the parabola y = ax^2 + bx + c, where a != 0, is -b/(2a).
Example 7
USING THE VERTEX FORMULA
Use the formula above to find the vertex of Lhe parabola y=2x^2-4x+3.
In this equation, a = 2 , b = -4, and c = 3. By the formula given above, the x-value of the vertex of the parabola is
x=-b/(2a)=(-4)/(2(2))=1
The y-value is found by substituting 1 for x into the equation y=2x^2-4x+3 to get y = 2(1)^2 - 4(1) + 3 = 1, so the vertex is (1, 1).
APPLICATION OF QUADRATIC RELATIONS Quadratic relations can be applied in situations as illustrated in the next example.
PROBLEM SOLVING
The fact that the vertex of a vertical parabola is the highest or lowest point on the graph makes equations of the form y = ax^2 + bx + c important in problems where the maximum or minimum value of some quantity is to be found. When a < 0, the y-value of the vertex gives the maximum value of y and the x-value tells where it occurs. Similarly, when a>0, the y-value of the vertex gives the minimum y-value.
Example 8
FINDING THE VERTEX IN AN APPLICATION
Ms. Whitney owns and operates Aunt Emma‘s Pie Shop. She has hired a consultant to analyze her business operations. The consultant tells her that her profit P in dollars is given by
P=120x-x^2
where x is the number of units of pies that she makes. How many units of pies should be made in order lo maximize the profit? What is the maximum possible profit?
The profit relation P can be rewritten as
P=-x^2+120x+0,
with a=-1,b=120, and c = 0. The graph of this relation will be a parabola opening downward, so that the vertex, of the form (x, P). will be the highest point on the graph. To find the vertex, use the fact that x = -b/(2a):
x=-120/(2(-1))=60
Let x = 60 in the equation to find the value of P at the vertex.
P=120x-x^2
P=120(60)-60^2
P=3600
The vertex is (60, 3600). Figure 3.23 shows the portion of the profit graph located in quadrant {Iota}. (Why is quadrant {Iota} the only one of interest here?) The maximum profit of $3600 occurs when 60 units of pies are made. In this case, profit increases as more and more pies are made up to 60 units and then decreases as more pies are made past this point.
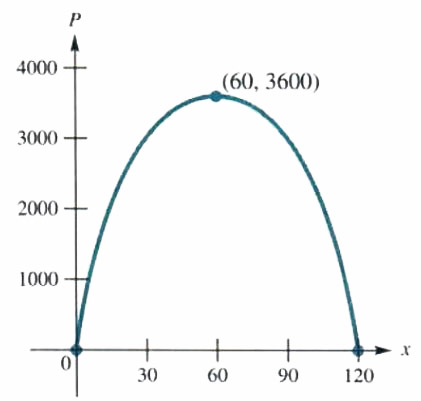
Figure 3.23
In this section, we started by defining a quadratic relation y = ax^2 + bx + c and, by point-plotting, found the graph, which we called a parabola. It is possible to start with a parabola. a set of points in the plane, and find the corresponding relation, using the formal geometric definition of a parabola.
GEOMETRIC DEFINITION OF A PARABOLA Geometrically, a parabola is defined as the set of all points in a plane that are equally distant from a fixed point and a fixed line not containing the point. The point is called the focus and the line is the directrix. The line through the focus and perpendicular to the directrix is the axis of the parabola. The point on the axis that is equally distant from the focus and the directrix is the vertex of the parabola.
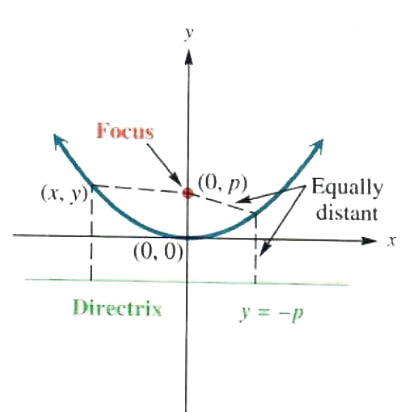
Figure 3.24
The parabola in Figure 3.24 has the point (0, p) as focus and the line y = -p as directrix. The vertex is (0,0). Let (x, y) be any point on the parabola. The distance from (x, y) to the directrix is |y - (-p)|, while the distance from (x, y) to (0, p) is root((x-0)^2+(y-p)^2). Since (x, y) is equally distant from the directrix and the focus,
|y - (-p)|=root((x-0)^2+(y-p)^2)
Square both sides, getting
(y+p)^2=x^2+(y-p)^2
y^2+2py+p^2=x^2+y^2-2py+p^2
4py=x^2
the equation of the parabola with focus (0, p) and directrix y = -p. Solving 4py = x^2 for y gives
y=1/(4p)x^2,
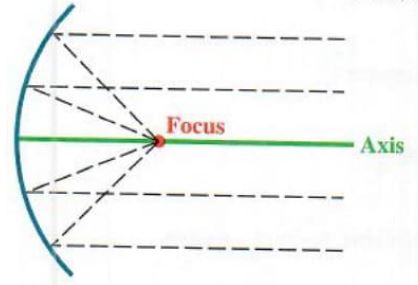
Figure 3.25
so that 1/(4p) = a when the equation is written in the form y = ax^2+bx+c.
This result could be extended to a parabola with vertex at (h, k), focus p units above (h, k), and directrix p units below (h, k), or to a parabola with vertex at (h, k), focus p units below (h, k), and directrix p units above (h, k).
The geometric properties of parabolas lead to many practical applications. For example, if a light source is placed at the focus of a parabolic reflector, as in Figure 3.25, light rays reflect parallel to the axis, making a spotlight or flashlight. The process also works in reverse. Light rays from a distant source come in parallel to the axis and are reflected to a point at the focus. (If such a reflector is aimed at the sun, a temperature of several thousand degrees may be obtained.) This use of parabolic reflection is seen in the satellite dishes used to pick up signals from communications satellites.
HORIZONTAL PARABOLAS The directrix of a parabola could be the vertical line x = -p, where p > 0. with focus on the x-axis at (p, 0), producing a parabola opening to the right. This parabola is the graph of the relation y^2 = 4px or x = [l/(4p)]y^ 2. The next examples show the graphs of horizontal parabolas with equations of the form x = ay^2 + by + c.
Example 9
GRAPHING A HORIZONTAL PARABOLA
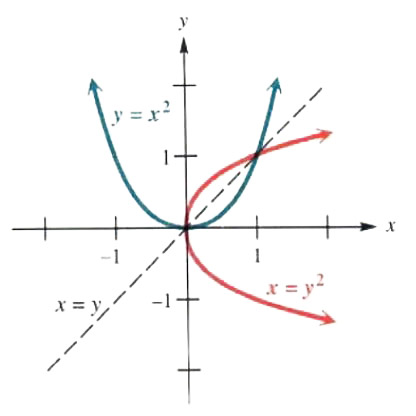
Figure 2.6
Graph x=y^2.
The equation x=y^2 can be obtained from y=x^2 by exchanging x and y. Choosing values of y and finding the corresponding values of x gives the parabola in Figure 3.26. The graph of x=y^2, shown in red, is symmetric with respect to the line y = 0 and has vertex at (0,0). For comparison. the graph of y=x^2 is shown in blue. These graphs are mirror images of each other with respect to the line y = x. From the graph, the domain of x=y^2 is (0,∞), and the range is (-∞,∞).
NOTE
The domain and the range of a horizontal parabola, such as x = y^2 in Figure 3.26, can be determined by looking at the graph. Since the vertex (0,0) has the smallest xx-value of any point on the graph, and the graph extends indefinitely to the right. the domain is (0,∞). Because the graph extends upward and downward indefinitely, the range is (-∞,∞).
EXAMPLE 10
COMPLETING THE SQUARE TO GRAPH A HORIZONTAL PARABOLA
Graph x=2y^2+6y+5.
To write this equation in the form x=a(y-k)^2+h, complete the square on y as follows:
x=2y^2+6y+5
x/2-y^2+3y+5/2 Divide by 2
x/2-5/2=y^2+3y Subtract 5/2.
x/2-5/2+9/4=y^2+3y+9/4 Add 9/4.
x/2-1/4=(y+3/2)^2 Combine terms; factor.
x/2=(y+3/2)^2+1/4 Add 1/4.
x=2(y+3/2)^2+1/2 Multiply by 2.
As this result shows. the vertex of the parabola is the point (1/2, -3/2). The axis is the horizontal line
y+3/2=0 or y=-3/2.
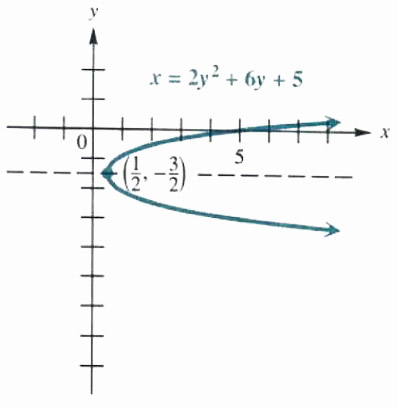
Figure 2.7
There is no y-intercept, since the vertex is on the right of the y-axis and the graph opens to the right. However, the x-intercept is
x=2(0)^2+6(0)+5=5.
Using the vertex. the axis of symmetry, and the x-intercept, and plotting a few additional points gives the graph in Figure 3.27. The domain is (1/2, ∞) and the range is (-∞,∞).
The vertex of a horizontal parabola can also be found by using the values of a and b in x=ay^2 +by +0.
Let’s see how our solver generates graph of this and similar problems. Click on "Solve Similar" button to see more examples.
VERTEX OF A PARABOLA (x=ay^2+by+c)
The y-value of the vertex of the parabola
x=ay^2+by+c, where a!=0,
is -b/(2a) The x-value is found by substitution of -b/(2a) for y.
CAUTION Be careful when using the two vertex formulas of this section. It is essential that you recognize whether the parabola is a vertical parabola or a horizontal one, so that you can decide whether -b/(2a) represents the x- or y-coordinate of the vertex. (It always represents the coordinate of the variable that is squared.)