




Standardized Test Z-Score and Percentile Problem
What This Problem Teaches
- Converting raw scores to standardized z-scores using the formula z = (x - μ) / σ
- Using the standard normal distribution table to find cumulative probabilities
- Understanding that "percent above" means finding the upper tail area (1 - cumulative probability)
- Interpreting z-scores as measures of relative performance within a population
- Connecting abstract statistical concepts to real educational assessment scenarios
Visualizing the Distribution
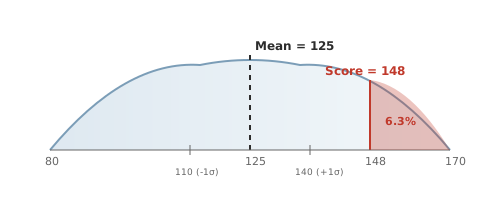
This normal curve shows the distribution of test scores. The shaded red area represents the 6.3% of students who scored higher than 148.
Solution: Method 1 — Z-Score and Standard Normal Table
Step 1 — Calculate the z-score
The z-score formula standardizes any normal distribution to the standard normal distribution (mean = 0, standard deviation = 1):
Where x = 148 (student's score), μ = 125 (population mean), and σ = 15 (population standard deviation):
Step 2 — Interpret the z-score
A z-score of 1.53 means the student scored 1.53 standard deviations above the mean. This is a strong performance — most students score within 2 standard deviations of the mean.
Step 3 — Look up the z-score in the standard normal table
The standard normal table gives us the area to the left of (below) any z-score. For z = 1.53:
This means 93.70% of students scored at or below 148.
Step 4 — Find the area to the right (above)
We want the percentage who scored higher than 148, which is the area to the right of z = 1.53:
Step 5 — Convert to percentage
Converting the probability to a percentage:
Solution: Method 2 — Empirical Rule Estimation
Step 1 — Apply the empirical rule as a starting point
The empirical rule tells us that in a normal distribution:
- About 68% of data falls within 1 standard deviation of the mean (110 to 140)
- About 95% falls within 2 standard deviations (95 to 155)
- About 99.7% falls within 3 standard deviations (80 to 170)
Step 2 — Locate the score within these ranges
The score of 148 is between +1σ (140) and +2σ (155). Since 95% of scores fall between -2σ and +2σ, and the distribution is symmetric, 2.5% of scores are above +2σ (155).
Step 3 — Estimate using the known boundaries
We know:
- 16% of scores are above +1σ (140)
- 2.5% of scores are above +2σ (155)
Since 148 is about halfway between 140 and 155, our answer should be roughly halfway between 16% and 2.5%, or around 9%.
Step 4 — Refine with the exact z-score
For precision, we calculate z = (148 - 125) / 15 = 1.53 and use the standard normal table to get 6.30%, which confirms our estimate was in the right ballpark.
Verification
Let's verify our calculation by checking the z-score and table lookup:
Check the z-score calculation
Check the table lookup
For z = 1.53, the cumulative probability is indeed 0.9370, meaning 93.70% scored at or below 148. Therefore, 100% - 93.70% = 6.30% scored higher. ✓
Sanity check
The score of 148 is significantly above average (125), so it makes sense that only a small percentage scored higher. Our answer of 6.30% seems reasonable.
Common Mistakes to Avoid
The Pattern Behind This
This problem follows the standard template for "upper tail probability" questions in normal distributions:
Where Φ represents the cumulative distribution function of the standard normal distribution.
The key insight is that any normal distribution can be transformed to the standard normal distribution through z-scores, allowing us to use the same table for all normally distributed data. This is why standardized test scores are so useful — they provide a common scale for comparing performance across different tests and populations.
Why This Matters in Education
Understanding percentiles and z-scores is crucial in educational assessment because:
- Standardized testing: SAT, ACT, state achievement tests all report both raw scores and percentiles
- Special education: Eligibility often requires performance below the 16th percentile (z ≈ -1.0)
- Gifted programs: Entry might require performance above the 95th percentile (z ≈ +1.65)
- Research: Educational researchers use these techniques to compare interventions and measure achievement gaps
What If?
z = (110 - 125) / 15 = -15 / 15 = -1.00
P(Z ≤ -1.00) = 0.1587
P(Z > -1.00) = 1 - 0.1587 = 0.8413
0.8413 × 100% = 84.13%
A score of 110 is one standard deviation below the mean, so about 84% scoring higher makes sense.
Answer: 84.13% scored higher than 110.
z_A = (148 - 125) / 15 = 23 / 15 = 1.53
z_B = (235 - 200) / 25 = 35 / 25 = 1.40
Student A: z = 1.53 (1.53 standard deviations above mean)
Student B: z = 1.40 (1.40 standard deviations above mean)
Student A: 93.70th percentile
Student B: 91.92nd percentile
Both scored well above their respective means, but Student A's relative performance was slightly better.
Answer: Student A performed better relative to their peers.
Top 10% means 90th percentile. From the table: z = 1.28
z = (x - μ) / σ, so x = z·σ + μ
x = 1.28 × 15 + 125 = 19.2 + 125 = 144.2
Since test scores are typically whole numbers, round up to 145.
Check: z = (145 - 125) / 15 = 1.33, which gives about 90.8th percentile ✓
Answer: A score of 145 is needed to be in the top 10%.
This leaves 16% in each tail (below 16th percentile and above 84th percentile).
16th percentile: z = -1.00
84th percentile: z = +1.00
Lower bound: x = (-1.00)(15) + 125 = 110
Upper bound: x = (1.00)(15) + 125 = 140
This is the empirical rule: 68% fall within one standard deviation of the mean.
Mean ± 1 SD = 125 ± 15 = 110 to 140 ✓
Answer: The middle 68% scored between 110 and 140.
Frequently Asked Questions
2026-08-11