




Exponential Growth: Calculating Annual Property Appreciation
What This Problem Teaches
- Setting up exponential growth models from real-world data points
- Solving for unknown growth rates using nth roots
- Projecting future values using established exponential patterns
- Converting between different representations of exponential growth
- Understanding the power of compound appreciation over time
Visualizing the Growth
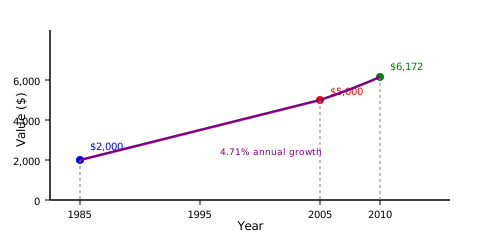
Solution: Method 1 — The Exponential Base Approach
Exponential growth follows the formula V = P(1 + r)^t, where V is the final value, P is the initial value, r is the annual growth rate, and t is time in years.
Step 1 — Set up the exponential equation
We know the house was worth $2,000 in 1985 and $5,000 in 2005. The time span is 2005 - 1985 = 20 years.
5000 = 2000(1 + r)^20
Step 2 — Isolate the growth factor
Divide both sides by 2000 to isolate the growth factor (1 + r)^20:
2.5 = (1 + r)^20
Step 3 — Solve for the growth rate
To find (1 + r), we take the 20th root of both sides:
(1 + r) = 2.5^0.05
(1 + r) = 1.0471
Therefore: r = 1.0471 - 1 = 0.0471 = 4.71%
Step 4 — Calculate the 2010 value
Now we project forward to 2010, which is 2010 - 1985 = 25 years from the original 1985 value:
V = 2000 × 3.086
V = $6,172
Solution: Method 2 — Continuous Compounding Model
We can also model this as continuous exponential growth using V = Pe^(kt), where k is the continuous growth rate.
Step 1 — Set up the continuous growth equation
5000 = 2000e^(k×20)
Step 2 — Solve for the continuous rate
Divide by 2000 and take the natural logarithm:
ln(2.5) = 20k
0.9163 = 20k
k = 0.0458
Step 3 — Convert to annual rate
The equivalent annual rate is e^k - 1 = e^0.0458 - 1 = 0.0469 = 4.69%
Step 4 — Calculate 2010 value with continuous model
V = 2000e^1.145
V = 2000 × 3.143
V = $6,286
The slight difference ($6,172 vs $6,286) comes from discrete vs. continuous compounding assumptions.
2010 house value: $6,172
Verification
Let's verify our answer by checking if 4.71% annual growth takes us from $2,000 in 1985 to $5,000 in 2005:
V = 2000 × 2.5
V = $5,000 ✓
Perfect! Our calculated rate produces exactly the given 2005 value.
We can also verify the 2010 calculation by working forward from the 2005 value:
V = 5000 × 1.2344
V = $6,172 ✓
Common Pitfalls
The house increased from $2,000 to $5,000, a total increase of 150%. Students often divide this by 20 years to get 7.5% annual growth. This ignores compounding entirely.
Some students calculate 2010 value using only 5 years (2005 to 2010). The correct approach uses 25 years from the original 1985 base or 5 years from the 2005 value with the established rate.
After finding
(1 + r) = 1.0471, students sometimes report 104.71% as the annual growth rate. The rate is r = 0.0471 = 4.71%.
The Pattern Behind This
This problem illustrates the standard exponential growth model, which appears throughout finance, biology, and physics:
When you have two data points (t₁, V₁) and (t₂, V₂), the growth rate is:
In our case: r = (5000/2000)^(1/20) - 1 = 2.5^0.05 - 1 = 4.71%
This formula works for any exponential growth scenario—population growth, investment returns, radioactive decay (with negative rates), or bacterial cultures.
Watch Out For These
70 ÷ 4.71 ≈ 14.9 years.
Where This Shows Up in Real Life
- Investment planning: Financial advisors use similar calculations to project retirement savings growth and determine required contribution rates
- Insurance valuation: Property insurance companies model home value appreciation to adjust coverage amounts and determine replacement costs
- Urban planning: City planners track property value trends to forecast tax revenue and assess the impact of development projects
- Lending decisions: Banks use historical appreciation rates to assess loan-to-value ratios and determine maximum mortgage amounts
What If?
Time period: 2010 - 1990 = 20 years140,000 = 80,000(1 + r)^20
1.75 = (1 + r)^20(1 + r) = 1.75^(1/20) = 1.0288r = 0.0288 = 2.88%
From 1990 to 2020 = 30 years:V = 80,000(1.0288)^30 = 80,000 × 2.375 = $190,000
Check: 80,000(1.0288)^20 = 80,000 × 1.75 = $140,000 ✓
Answer: 2.88% annual growth; 2020 value = $190,000
From 1995 to 2008 = 13 years
We need to work backwards from 2008 to 1995
250,000 = P(1.052)^13
Where P is the 1995 value we want to find
P = 250,000 ÷ (1.052)^13P = 250,000 ÷ 1.9068P = $131,098
Check: $131,098 × (1.052)^13 = $131,098 × 1.9068 = $250,000 ✓
Answer: The house was worth $131,098 in 1995
With quarterly compounding: V = P(1 + r/4)^(4t)
20 years = 80 quarters5000 = 2000(1 + r/4)^80
2.5 = (1 + r/4)^80(1 + r/4) = 2.5^(1/80) = 1.0115r/4 = 0.0115r = 0.0460 = 4.60%
Quarterly rate = r/4 = 4.60%/4 = 1.15% per quarter
Check: 2000(1.0115)^80 = 2000 × 2.5 = $5,000 ✓
Annual equivalent: (1.0115)^4 - 1 = 4.69%
(Slightly less than our 4.71% annual rate)
Answer: 1.15% quarterly rate (4.60% nominal annual rate)
Growth period: 2000 to 2010 = 10 years at +4.71%V₂₀₁₀ = 180,000(1.0471)^10V₂₀₁₀ = 180,000 × 1.5811 = $284,598
Decline period: 2010 to 2015 = 5 years at -2.1%
For depreciation: (1 + r) = (1 - 0.021) = 0.979V₂₀₁₅ = 284,598(0.979)^5
V₂₀₁₅ = 284,598 × 0.9005 = $256,237
Despite 5 years of decline, the house is still worth more than its 2000 value ($180,000) due to 10 years of strong growth.
Net effect over 15 years: 42% total appreciation
Answer: The house is worth $256,237 in 2015
Frequently Asked Questions
2026-07-17