




Standard Deviation After Linear Adjustment Formula
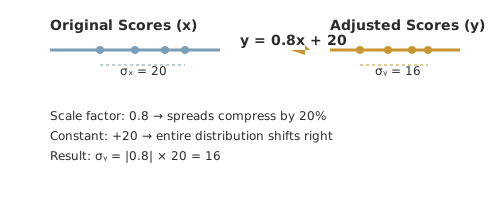
What This Problem Teaches
- Linear transformation properties: Understanding how y = ax + b affects measures of spread versus location
- Standard deviation scaling: Recognizing that standard deviation transforms by the absolute value of the coefficient
- Invariance under translation: Seeing why adding constants doesn't change variability
- Statistical reasoning: Connecting algebraic transformations to their meaning in data analysis
- Pattern recognition: Identifying when to apply transformation rules versus computing from scratch
Solution: Method 1 — The Linear Transformation Rule
When data undergoes a linear transformation of the form y = ax + b, there's a fundamental rule about how the standard deviation changes. Let's apply this principle directly.
Step 1 — Identify the transformation components
The given transformation is y = 0.8x + 20, where:
• The coefficient a = 0.8 (this scales the data)
• The constant b = 20 (this shifts the data)
Step 2 — Apply the standard deviation transformation rule
For any linear transformation y = ax + b, the new standard deviation is:
The absolute value ensures the standard deviation remains positive, and notice that the constant b doesn't appear—it only shifts the data without affecting spread.
Step 3 — Calculate the new standard deviation
Substituting our values:
Step 4 — Understand why this works
The coefficient 0.8 compresses each score toward the mean by 20%, so the spread also compresses by the same factor. The +20 shifts every score equally, preserving all the distances between scores.
Solution: Method 2 — The Variance Transformation Approach
We can also solve this by working with variance (the square of standard deviation), which follows its own transformation rule, then converting back.
Step 1 — Find the original variance
Since standard deviation is 20, the original variance is:
Step 2 — Apply the variance transformation rule
For y = ax + b, the new variance is:
Notice that the coefficient gets squared in the variance transformation.
Step 3 — Calculate the new variance
Substituting our values:
Step 4 — Convert back to standard deviation
Taking the square root of the variance:
This confirms our answer from Method 1 and shows the relationship between variance and standard deviation transformations.
Verification
Let's verify our answer by checking with a concrete example. Suppose three students had original scores of 60, 80, and 100.
Original scores: 60, 80, 100
Mean: (60 + 80 + 100) ÷ 3 = 80
Deviations: -20, 0, +20
Standard deviation: √[(20² + 0² + 20²) ÷ 3] = √[800 ÷ 3] ≈ 16.33
Adjusted scores: 0.8(60) + 20 = 68, 0.8(80) + 20 = 84, 0.8(100) + 20 = 100
New mean: (68 + 84 + 100) ÷ 3 = 84
New deviations: -16, 0, +16
New standard deviation: √[(16² + 0² + 16²) ÷ 3] = √[512 ÷ 3] ≈ 13.06
The ratio is 13.06 ÷ 16.33 ≈ 0.8, confirming our transformation rule. ✓
Watch Out For These
Incorrect reasoning: "Since we add 20, the standard deviation becomes 20 + 16 = 36"
Why it's wrong: Adding a constant shifts all values equally, so the distances between values (which determine spread) remain unchanged.
Incorrect reasoning: For y = -0.5x + 10, claiming the new standard deviation is negative
Why it's wrong: Standard deviation is always positive. Use |a| = |-0.5| = 0.5 as the multiplier.
Incorrect reasoning: "Since a = 0.8, the new standard deviation is (0.8)² × 20 = 12.8"
Why it's wrong: This mixes up variance and standard deviation rules. For standard deviation, multiply by |a|, not a².
The Math Beneath the Surface
This problem reveals a fundamental principle about linear transformations in statistics:
y = ax + b:
• Standard deviation:
σᵧ = |a| × σₓ• Variance:
σᵧ² = a² × σₓ²• Mean:
μᵧ = a × μₓ + bThis principle extends beyond test scores to any data transformation. Whether you're converting temperatures, adjusting measurements, or scaling survey responses, these rules always apply.
The key insight is that linear transformations affect location (mean) and scale (standard deviation) in predictable, separate ways. The coefficient controls scaling, while the constant controls shifting.
Why This Matters
Standardized testing: When test scores are curved or adjusted, understanding how the spread changes helps interpret the results.
Data normalization: In data science, linear transformations are used to rescale variables, and knowing how variance changes is crucial for analysis.
Quality control: Manufacturing processes often apply corrections to measurements, and predicting the resulting variability helps maintain quality standards.
What If?
We have y = 1.2x + 15, so a = 1.2 and b = 15.
The new standard deviation is σᵧ = |a| × σₓ = |1.2| × 18 = 1.2 × 18 = 21.6.
Since 1.2 > 1, the adjustment spreads scores out more, increasing variability. ✓
Answer: 21.6
We know σᵧ = |a| × σₓ, so 9 = |0.6| × σₓ.
9 = 0.6 × σₓ, so σₓ = 9 ÷ 0.6 = 15.
Check: 0.6 × 15 = 9 ✓
Answer: The original standard deviation was 15.
We have y = -0.5x + 120, so a = -0.5.
The standard deviation transformation uses |a| = |-0.5| = 0.5.
σᵧ = |a| × σₓ = 0.5 × 12 = 6
Negative coefficient flips the direction but doesn't change the magnitude of spread. ✓
Answer: The standard deviation of final grades is 6.
For y₁ = 0.8x + 20: σ₁ = |0.8| × 20 = 16
For y₂ = 1.5y₁ - 10: σ₂ = |1.5| × 16 = 24
We could also combine: y₂ = 1.5(0.8x + 20) - 10 = 1.2x + 20
So σ₂ = |1.2| × 20 = 24 ✓
Both methods give the same answer: 24
Answer: The final standard deviation is 24.
Frequently Asked Questions
2026-10-22