




Probability with Two-Way Tables: Union of Events
The table below shows the number of survey subjects who have received and not received a speeding ticket in the last year, and the color of their car.
| Speeding Ticket | No Speeding Ticket | Total | |
|---|---|---|---|
| Red Car | 19 | 438 | 457 |
| Not Red Car | 41 | 143 | 184 |
| Total | 60 | 581 | 641 |
If one person is randomly selected from the group, what is the probability that this person drives a red car or got a speeding ticket?
Probability = ?
What This Problem Teaches
- How to apply the inclusion-exclusion principle to find P(A or B)
- Reading and interpreting two-way frequency tables for probability calculations
- Understanding why you subtract the intersection to avoid double-counting
- Using the complement strategy as an alternative solution method
- Converting between counts and probabilities in real-world contexts
Visualizing the Data
Let's create a visual representation to understand the relationships between the events:
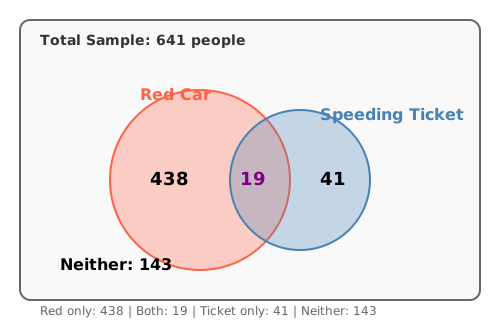
This Venn diagram shows how the 641 people are distributed across the four possible categories. Notice that 19 people appear in both circles—they drive red cars and got tickets.
Solution: Method 1 — The Inclusion-Exclusion Approach
Step 1 — Identify the events and their counts
From the table, we need:
- People with red cars:
457 - People with speeding tickets:
60 - People with both red cars and tickets:
19 - Total people surveyed:
641
Step 2 — Apply the inclusion-exclusion principle
For "A or B" events, we use: P(A or B) = P(A) + P(B) - P(A and B)
Step 3 — Convert counts to probabilities
Divide each count by the total sample size:
P(red car) = 457/641P(ticket) = 60/641P(both) = 19/641
Step 4 — Perform the calculation
Step 5 — Simplify if possible
To check if this fraction can be simplified, we need the GCD of 498 and 641. Since 641 is prime, and 498 = 2 × 3 × 83, these numbers share no common factors. The fraction 498/641 is already in lowest terms.
Solution: Method 2 — The Complement Strategy
Step 1 — Identify the complement
Instead of finding P(red car or ticket), we'll find P(NOT red car AND NOT ticket), then subtract from 1.
Step 2 — Find people with neither characteristic
From the table, people who drive non-red cars AND have no ticket: 143 people
Step 3 — Calculate the complement probability
Step 4 — Use the complement rule
This confirms our first method's answer!
Verification
Let's verify our answer using a direct count approach:
People who drive red cars OR got tickets include:
- Red car drivers with tickets:
19 - Red car drivers without tickets:
438 - Non-red car drivers with tickets:
41
Total: 19 + 438 + 41 = 498 people
Probability: 498/641 ✓
As a decimal: 498 ÷ 641 ≈ 0.7769 or about 77.7% ✓
Watch Out For These
✗ Adding without subtracting the overlap
Incorrect: P(red or ticket) = 457/641 + 60/641 = 517/641
This counts the 19 people who have both characteristics twice. You must subtract the intersection to avoid double-counting.
✗ Using "and" instead of "or"
Incorrect: P(red and ticket) = 19/641
The problem asks for "red car OR got a ticket," not "red car AND got a ticket." These are completely different questions with different answers.
✗ Reading the table incorrectly
Incorrect: Using 438 as the total number of red car drivers
The number 438 represents red car drivers who did NOT get tickets. The total number of red car drivers is 457 (which includes the 19 who did get tickets).
✗ Forgetting the total sample size
Incorrect: P(red or ticket) = 498
Probability must be between 0 and 1. You need to divide the favorable outcomes (498) by the total sample size (641) to get a proper probability.
Does This Seem Reasonable?
Our answer of about 77.7% makes intuitive sense. Here's why:
- Red car drivers alone make up
457/641 ≈ 71.3%of the sample - Ticket recipients add another
60/641 ≈ 9.4% - But there's overlap of
19/641 ≈ 3.0%that we must subtract - Net result:
71.3% + 9.4% - 3.0% = 77.7%✓
The majority of people (71.3%) already drive red cars, so adding the ticket holders only increases this to about 78%. The small overlap prevents it from reaching the naive sum of 81%.
The Pattern Behind This
This problem demonstrates the fundamental inclusion-exclusion principle for the union of two events:
In words: "The probability of A or B equals the probability of A plus the probability of B minus the probability of both A and B."
This principle extends to any two-way table problem where you need to find the probability of belonging to at least one category. The key insight is that simple addition double-counts the intersection, so you must subtract it once to get the correct total.
When to use each method:
- Use inclusion-exclusion when the individual probabilities are easy to identify
- Use the complement when the "neither" category is easy to spot and calculate
- Both methods should always yield the same answer—use one to check the other
Real Applications
This type of "union probability" calculation appears frequently in:
- Medical testing: Finding the probability that a patient has condition A or condition B when conditions sometimes co-occur
- Marketing analysis: Calculating the reach of advertising campaigns that target overlapping demographics
- Quality control: Determining the probability that a product fails for reason X or reason Y, where both failure modes can happen simultaneously
What If?
Red car drivers: 520, Ticket recipients: 25 + 35 = 60, Both (red car AND ticket): 25, Total sample: 700
P(red or ticket) = P(red) + P(ticket) - P(both) = 520/700 + 60/700 - 25/700
(520 + 60 - 25)/700 = 555/700
555/700 = 111/140 (dividing by 5)
As a decimal: 111/140 ≈ 0.793 or about 79.3%. ✓
Answer: 111/140 ≈ 0.793 or 79.3%
We want P(red car | got ticket), which means "probability of red car given that we know they got a ticket."
P(red | ticket) = P(red and ticket) / P(ticket)
People with red cars AND tickets: 19, Total people with tickets: 60
P(red | ticket) = 19/60
This makes sense: among the 60 ticket recipients, 19 drive red cars. 19/60 ≈ 0.317 or about 31.7%. ✓
Answer: 19/60 ≈ 0.317 or 31.7%
A = drives red car (280 people), B = drives blue car (200 people), C = got ticket (15 + 25 + 20 = 60 people)
Red and ticket: 15, Blue and ticket: 25, Red and blue: 0 (mutually exclusive car colors)
P(A ∪ B ∪ C) = P(A) + P(B) + P(C) - P(A ∩ B) - P(A ∩ C) - P(B ∩ C) + P(A ∩ B ∩ C)
280/641 + 200/641 + 60/641 - 0 - 15/641 - 25/641 + 0 = 500/641
Direct count: 280 red + 200 blue + 20 other-with-tickets = 500 people. ✓
Answer: 500/641 ≈ 0.780 or 78.0%
P(red or ticket) = 5/8, so the number of people = (5/8) × 800 = 500 people
500 = 400 + T - 30, where T = total people with tickets
500 = 400 + T - 30500 = 370 + TT = 130
Check: P(red or ticket) = (400 + 130 - 30)/800 = 500/800 = 5/8 ✓
This means 130 people got tickets, which is reasonable for a sample of 800 people.
Answer: 130 people got speeding tickets
Frequently Asked Questions
Use the inclusion-exclusion principle: P(A or B) = P(A) + P(B) - P(A and B). Add the individual probabilities, then subtract the overlap to avoid double-counting. In this problem, P(red car) = 457/641, P(ticket) = 60/641, and P(both) = 19/641, giving us 457/641 + 60/641 - 19/641 = 498/641.
Because simply adding P(A) + P(B) counts the overlap twice. When you count all red cars (457) and all ticket recipients (60), the 19 people who are both red car drivers AND got tickets appear in both counts. Subtracting P(A and B) removes this double-counting.
Find P(not A and not B) first, then subtract from 1. It's often easier to count what you don't want than what you do. In this example, people who don't drive red cars AND didn't get tickets are the 143 non-red, no-ticket drivers. So P(red or ticket) = 1 - 143/641 = 498/641.
2026-07-21