




Understanding Central Tendency: Mean, Median, and Mode
The following table shows how many siblings a sample of people reported they had.
| Number of Siblings | 0 | 1 | 2 | 3 | 4 | 5 |
|---|---|---|---|---|---|---|
| Frequency | 6 | 5 | 3 | 1 | 0 | 2 |
A. Find the mean. [1]
B. Find the median. [1]
C. Find the mode. [1]
D. Which of the above best represents the number of siblings? Explain.
What You Will Learn
Visualizing the Data
Let's look at what this frequency table tells us. We can see the distribution clearly in a bar chart:
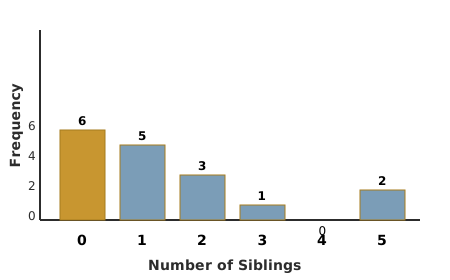
Notice how 0 siblings (highlighted in gold) is the most common response, while the data tapers off for larger families. This shape will help us understand which measure of central tendency tells the most meaningful story.
Solution: Method 1 — The Frequency Table Approach
Step 1 — Find the total number of people surveyed
Add up all the frequencies: 6 + 5 + 3 + 1 + 0 + 2 = 17 people
Step 2 — Calculate the mean using weighted averages
For frequency data, the mean is the sum of (value × frequency) divided by total frequency:
= (0 + 5 + 6 + 3 + 0 + 10) ÷ 17
= 24 ÷ 17
= 1.41 siblings
Step 3 — Find the median position
With 17 people, the median is the 9th value when data is arranged in order (since (17+1)÷2 = 9). Now we count through the frequencies:
- Positions 1-6: 0 siblings
- Positions 7-11: 1 sibling
- Positions 12-14: 2 siblings
The 9th person has 1 sibling, so the median is 1.
Step 4 — Identify the mode
The mode is the value that appears most frequently. Looking at our table, 0 siblings has the highest frequency (6 people), so the mode is 0 siblings.
Step 5 — Determine which measure best represents the data
The median (1 sibling) best represents this data because:
- It's not affected by the few families with many siblings (like the 2 families with 5 siblings)
- It represents where the "middle" family falls
- The mean (1.41) is pulled upward by the larger families and doesn't represent a typical response
- The mode (0) represents the single most common response but doesn't account for the overall distribution
Solution: Method 2 — The Cumulative Distribution Method
Step 1 — Build a cumulative frequency table
| Siblings | Frequency | Cumulative Frequency | Value × Frequency |
|---|---|---|---|
| 0 | 6 | 6 | 0 |
| 1 | 5 | 11 | 5 |
| 2 | 3 | 14 | 6 |
| 3 | 1 | 15 | 3 |
| 4 | 0 | 15 | 0 |
| 5 | 2 | 17 | 10 |
Step 2 — Calculate mean from the products column
= (0 + 5 + 6 + 3 + 0 + 10) ÷ 17 = 1.41 siblings
Step 3 — Use cumulative frequency to find median
The median position is 9. Looking at cumulative frequencies, position 9 falls where the cumulative frequency first reaches or exceeds 9. Since cumulative frequency reaches 11 at "1 sibling," the median is 1 sibling.
Step 4 — Compare all measures
- Mean: 1.41 siblings (pulled up by larger families)
- Median: 1 sibling (middle value, unaffected by outliers)
- Mode: 0 siblings (most common single response)
The median provides the best representation because this data is right-skewed (more families have fewer siblings, with a tail extending toward larger families). The median is resistant to this skewness.
B. Median = 1 sibling
C. Mode = 0 siblings
D. The median best represents the data because it's not affected by the skewed distribution toward larger families.
Verification
Check the mean calculation:
Total people = 6 + 5 + 3 + 1 + 0 + 2 = 17
Mean = 24 ÷ 17 = 1.41... ✓
Check the median: Write out all 17 data points in order:
0, 0, 0, 0, 0, 0, 1, 1, 1, 1, 1, 2, 2, 2, 3, 5, 5
The 9th value is 1 ✓
Check the mode: 0 appears 6 times, which is more than any other value ✓
Check that frequencies sum correctly:6 + 5 + 3 + 1 + 0 + 2 = 17 ✓
What Trips Students Up
Some students calculate mean as (0 + 1 + 2 + 3 + 4 + 5) ÷ 6 = 2.5, forgetting that each value appears multiple times. You must multiply each value by its frequency before adding.
The median is not the middle frequency value (which would be between 1 and 3). The median is the middle value in the actual dataset of 17 responses.
The mode is the most frequently occurring data value (0), not the value that appears in the middle frequency position. Don't mix up "most common value" with "middle value."
The Pattern Behind This
This problem demonstrates the general principle for analyzing frequency distributions:
Median position = (n + 1) ÷ 2, where n = total frequency
Mode = value with highest frequency
The key insight is understanding when each measure is most useful:
- Mean: Best for symmetric data, but sensitive to outliers
- Median: Best for skewed data or data with outliers
- Mode: Best for categorical data or when you need the most typical response
In this problem, the data is right-skewed (long tail toward higher values), making the median the most representative measure of central tendency.
When Numbers Get Messy
In this problem, we got a clean median (1) and mode (0), but a decimal mean (1.41). This is completely normal for real data — don't round the mean to a whole number just because we're counting siblings.
If our frequency table had been slightly different — say, 7 people with 0 siblings instead of 6 — our calculations would be:
Median = 9.5th position = average of 9th and 10th values = (1 + 1) ÷ 2 = 1
Mode = 0 (still the most frequent)
The method stays exactly the same — the only difference is that we might get messier decimals or need to average two middle values for the median.
What If?
Total = 2 + 4 + 6 + 3 + 2 + 1 = 18 people
Mean = (0×2 + 1×4 + 2×6 + 3×3 + 4×2 + 5×1) ÷ 18
= (0 + 4 + 12 + 9 + 8 + 5) ÷ 18 = 38 ÷ 18 = 2.11 siblings
Median position = 9.5 (average of 9th and 10th values)
Positions 1-2: 0 siblings, 3-6: 1 sibling, 7-12: 2 siblings
Both 9th and 10th people have 2 siblings, so median = 2
2 siblings appears 6 times (highest frequency), so mode = 2 siblings
Mean = 2.11, Median = 2, Mode = 2. Since the distribution is more symmetric now, both the median and mode (which happen to be equal) best represent the data at 2 siblings.
0 siblings (6), 1 sibling (5), 2 siblings (3), 3 siblings (1), 4 siblings (0), 5 siblings (2), 12 siblings (1)
Total people = 18
Mean = (0×6 + 1×5 + 2×3 + 3×1 + 4×0 + 5×2 + 12×1) ÷ 18
= (0 + 5 + 6 + 3 + 0 + 10 + 12) ÷ 18 = 36 ÷ 18 = 2.00 siblings
Median position = 9.5 (average of 9th and 10th values)
The ordered list now has the value 12 at the end, but the 9th and 10th values are still both 1 sibling
New median = 1 sibling (unchanged)
0 siblings still appears most frequently (6 times)
New mode = 0 siblings (unchanged)
The mean changed most dramatically — from 1.41 to 2.00 siblings (increased by 42%). The median and mode were unaffected by the outlier, showing their resistance to extreme values.
20 people total, mean = 1.5 siblings
Known: 0 siblings (5), 1 sibling (4), 2 siblings (6), 3 siblings (3)
Unknown: 4 siblings (x), 5 siblings (y)
We know: 5 + 4 + 6 + 3 + x + y = 20, so x + y = 2
Total of all sibling values = mean × number of people = 1.5 × 20 = 30(0×5 + 1×4 + 2×6 + 3×3 + 4×x + 5×y) = 30(0 + 4 + 12 + 9 + 4x + 5y) = 3025 + 4x + 5y = 304x + 5y = 5
We have: x + y = 2 and 4x + 5y = 5
From first equation: y = 2 - x
Substituting: 4x + 5(2 - x) = 54x + 10 - 5x = 5-x = -5x = 5, but this is impossible since x + y = 2
Since x + y = 2 and both must be non-negative integers:
Try x = 0, y = 2: 4(0) + 5(2) = 10 ≠ 5
Try x = 1, y = 1: 4(1) + 5(1) = 9 ≠ 5
Try x = 2, y = 0: 4(2) + 5(0) = 8 ≠ 5
This problem has no solution with the given constraints. The mean of 1.5 is inconsistent with having exactly 20 people and the given frequency distribution. This illustrates why checking for consistency is important in statistics problems.
0-1 siblings: midpoint = (0 + 1) ÷ 2 = 0.5
2-3 siblings: midpoint = (2 + 3) ÷ 2 = 2.5
4-5 siblings: midpoint = (4 + 5) ÷ 2 = 4.5
Using midpoint method:
Mean ≈ (0.5×30 + 2.5×45 + 4.5×25) ÷ 100
= (15 + 112.5 + 112.5) ÷ 100
= 240 ÷ 100 = 2.4 siblings
This is only an estimate because we don't know the exact distribution within each range. For example:
• If most families in "0-1" actually have 0 siblings, the true mean would be lower
• If most families in "4-5" actually have 5 siblings, the true mean would be higher
Minimum mean (everyone at lower bounds): (0×30 + 2×45 + 4×25) ÷ 100 = 1.9
Maximum mean (everyone at upper bounds): (1×30 + 3×45 + 5×25) ÷ 100 = 2.9
So the true mean is between 1.9 and 2.9, with 2.4 as our best estimate.
Check frequencies sum to 100: 30 + 45 + 25 = 100 ✓
Check calculation: 15 + 112.5 + 112.5 = 240, 240 ÷ 100 = 2.4 ✓
Frequently Asked Questions
Multiply each value by its frequency, add all those products together, then divide by the total number of data points. In this problem: (0×6 + 1×5 + 2×3 + 3×1 + 4×0 + 5×2) ÷ 17 = 1.41 siblings. Don't just average the values themselves — you must weight them by how often they occur.
The median is typically best when you have outliers or skewed data, because it represents the middle value and isn't affected by extreme values. In this problem, the median of 1 sibling better represents typical families than the mean of 1.41, which is pulled up by the few families with many siblings.
When two or more values tie for the highest frequency, the dataset is bimodal or multimodal. Here, 0 siblings appears 6 times, which is the highest frequency, making 0 the single mode. If another value also appeared 6 times, we'd have two modes, suggesting the data has two distinct peaks or typical values.
2026-07-31