




Weighted Average Problem: Quality Control
What This Problem Teaches
- Setting up weighted average equations where quantities and rates both vary
- Understanding that percentages must be weighted by their corresponding quantities
- Recognizing mixture problems disguised as manufacturing scenarios
- Using algebraic manipulation to isolate unknown quantities in percentage contexts
- Verification strategies for percentage mixture problems
Visualizing the Problem
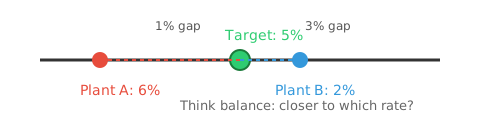
The visual shows how the overall 5% rate sits between the two plant rates. Since 5% is closer to Plant B's 2% rate than Plant A's 6% rate, we might expect Plant A to have produced more panels — which we'll verify algebraically.
Solution: Method 1 — The Weighted Average Approach
Step 1 — Define the unknown
Let x = number of panels produced by Plant B.
Step 2 — Understand what "overall percentage" means
The overall 5% defective rate means that out of all panels produced by both plants combined, exactly 5% are defective. This gives us our fundamental equation:
Step 3 — Express each component
We need to count defective panels from each plant separately:
- Plant A:
0.06 × 12000 = 720defective panels - Plant B:
0.02 × xdefective panels - Total panels:
12000 + x - Total defective:
0.05 × (12000 + x)
Step 4 — Set up the equation
720 + 0.02x = 0.05(12000 + x)
Step 5 — Solve for x
Expand the right side:
Subtract 0.02x from both sides:
Subtract 600 from both sides:
Divide by 0.03:
Solution: Method 2 — The Alligation Method
Step 1 — Find the "distances" from target
In mixture problems, we can use the alligation shortcut. Find how far each rate is from the target rate:
- Plant A:
6% - 5% = 1%above target - Plant B:
5% - 2% = 3%below target
Step 2 — Apply the inverse ratio rule
The quantities must be in the inverse ratio of their distances. Since Plant A is 1% away and Plant B is 3% away:
This means for every 3 units Plant A produces, Plant B produces 1 unit.
Step 3 — Calculate Plant B's production
Since Plant A produced 12000 panels, and the ratio is 3:1:
1 unit = 12000 ÷ 3 = 4000 panels
Therefore, Plant B produced 4000 panels.
Verification
Let's check our answer by computing the total defective rate:
| Plant | Panels Produced | Defect Rate | Defective Panels |
|---|---|---|---|
| Plant A | 12,000 | 6% | 720 |
| Plant B | 4,000 | 2% | 80 |
| Total | 16,000 | 5% | 800 |
What Trips Students Up
(6% + 2%) ÷ 2 = 4% and think this should be the overall rate. This ignores that Plant A produced three times as many panels as Plant B — the weighted nature of the average.
0.06 + 0.02x = 0.05, forgetting that we're dealing with weighted totals, not just rates. The percentages must be multiplied by their respective quantities.
The Pattern Behind This
This is a classic weighted average problem. The general formula for any two-component mixture is:
Where w represents weights (quantities) and r represents rates (percentages). In our case:
w₁ = 12000(Plant A panels),r₁ = 0.06w₂ = x(Plant B panels),r₂ = 0.02r_target = 0.05
How to Spot This Problem Type
Look for these telltale phrases:
- "Overall percentage" or "combined rate"
- Two or more sources with different rates/percentages
- One quantity known, another unknown
- Context involving mixing, manufacturing, or combining groups
- Words like "defective," "success rate," "concentration," or "composition"
These problems appear in many disguises: drug concentrations in pharmacy, pollution levels in environmental science, quality control in manufacturing, and portfolio returns in finance.
Real Applications
- Manufacturing quality control: Exactly this scenario — combining output from multiple production lines with different defect rates to meet overall quality targets.
- Financial portfolio management: Mixing investments with different return rates to achieve a target portfolio return.
- Pharmaceutical compounding: Combining solutions of different concentrations to create a medication with the prescribed strength.
What If?
Let x = panels from Plant B. Total defective = 0.04(8000) + 0.03x = 320 + 0.03x
320 + 0.03x = 0.035(8000 + x)
320 + 0.03x = 280 + 0.035x
40 = 0.005x, so x = 8000
Check: (320 + 240) ÷ 16000 = 560 ÷ 16000 = 0.035 = 3.5% ✓
Answer: Plant B produced 8000 panels.
Plant A: 0.06 × 9000 = 540 defective
Plant B: 0.02 × 3000 = 60 defective
Let x = Plant C panels. Total defective: 540 + 60 + 0.01x = 600 + 0.01x
600 + 0.01x = 0.04(9000 + 3000 + x) = 0.04(12000 + x)
600 + 0.01x = 480 + 0.04x120 = 0.03xx = 4000
Total defective: 540 + 60 + 40 = 640
Total panels: 16000
Rate: 640 ÷ 16000 = 4% ✓
Answer: Plant C produced 4000 panels.
Plant B: 6000 panels, 2% defective = 0.02 × 6000 = 120 defective panels
Let x = Plant A panels. Plant A defective: 0.07x
120 + 0.07x = 0.045(6000 + x)
120 + 0.07x = 270 + 0.045x0.025x = 150x = 6000
Plant A defective: 0.07 × 6000 = 420
Total: (420 + 120) ÷ 12000 = 540 ÷ 12000 = 4.5% ✓
Answer: Plant A produced 6000 panels.
Plant A defective: 0.06 × 9000 = 540 panels
Plant B defective: 0.02 × 3000 = 60 panels
Plant A cost: 540 × $8 = $4320
Plant B cost: 60 × $12 = $720
Total defective panels: 540 + 60 = 600
Total repair cost: $4320 + $720 = $5040
Average cost per defective panel: $5040 ÷ 600 = $8.40
Since Plant A has 90% of the defective panels at $8 each, the average should be close to $8. At $8.40, this makes sense.
Answer: The average cost per defective panel is $8.40.
Frequently Asked Questions
2026-07-13